

Newbie here…
I have a matrix table question of bipolar type with one statement and 9 scale points. The scale points have no text but there are 5 graphics. Graphics are attached to scale points 1, 3, 5, 7, and 9. Each graphic is 141 px W x 174 px H. My understanding is that Qualtrics fits the graphics into the standard width of the output screen, which renders as below.
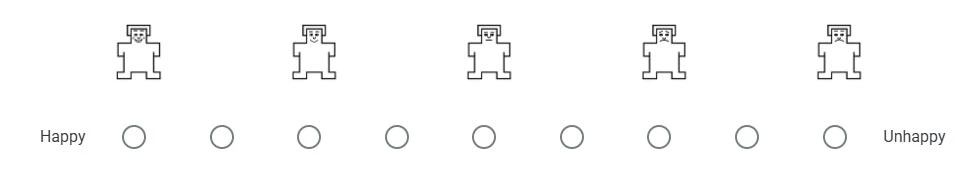
The graphics have been scaled down to approximately 55% of original size so they fit, and pixelation now makes it difficult to distinguish between them. I then added in Look and Feel > Style > Custom CSS:
img {
max-width: 200% !important;
}
With this change the screen renders as below.
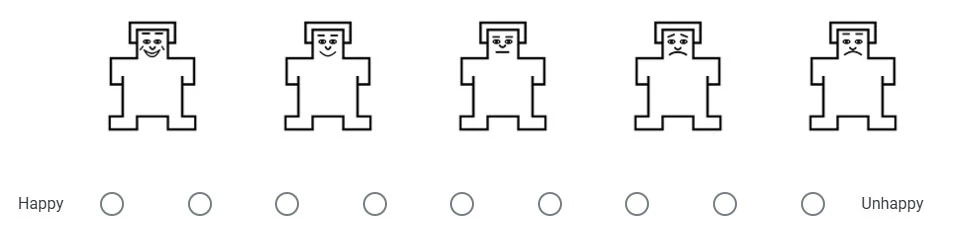
The graphics have been scaled up to approximately 110% of original size. They have also been shifted to the right. A right-shift was also present in the first rendering, but it is small enough to be acceptable.
So my question is: How can Qualtrics be controlled to render graphics at an acceptable (preferably controllable) size and be aligned with the radio buttons?
Any assistance gratefully received.


