
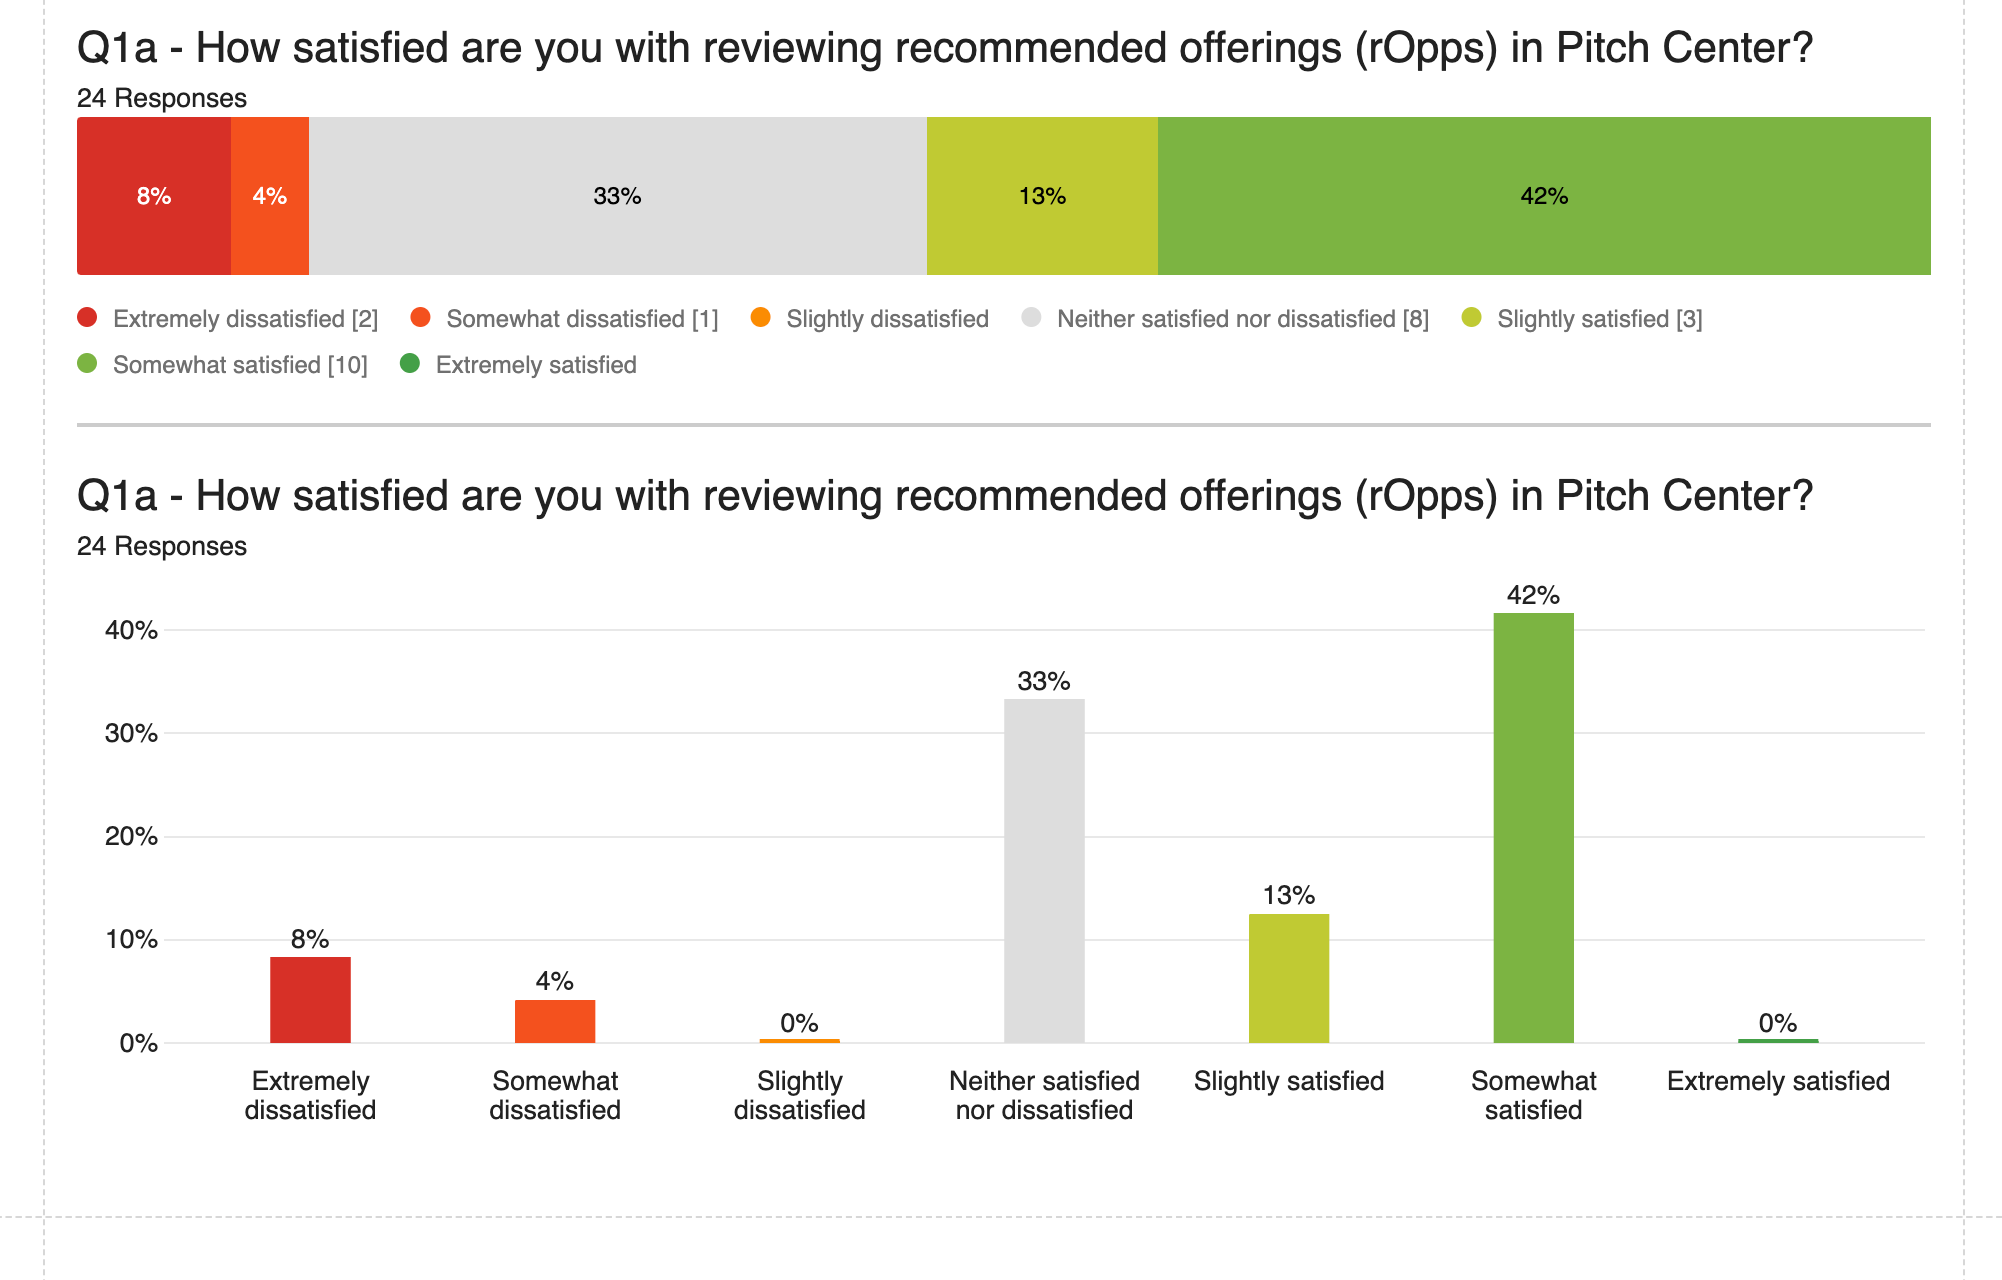
I have a 5-point Likert Scale (Strongly Disagree-Strongly Agree). None of my respondents selected the second point on the scale (disagree) and so the "simple table" and bar graphs are only showing 1-Strongly Disagree, 3-Neutral, 4-Agree, 5-Strongly Agree because there were respondents who selected some of those options. However, I need to be able to also show that 0 or 0% selected 2 (i.e. disagree) as a meaningful data-point. I reached out to support and they only confirmed that I have zero responses for the "Disagree" rating and that's why it's not displaying in the visualizations. They haven't given me a solution to fix it so that I can show that 0% disagree with a given topic.
Please help!

The simple tables visualizations are not showing any of the options with zero respones


Leave a Reply
Enter your E-mail address. We'll send you an e-mail with instructions to reset your password.