Include Response Rate in normal chart widget | XM Community
Skip to main content
Hi All,


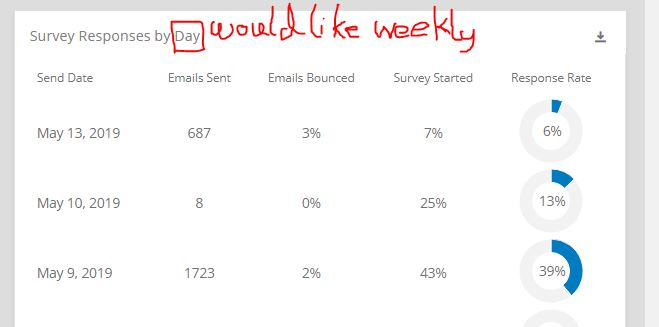
I'm aware of the Survey statistical widget which includes daily response rates. However, is there a way to include the response rate in a widget which tracks (for example) NPS or other scores. The statistical widget is daily and we'd like to turn it into a weekly rolling chart. Is there a way to do this other than exporting the data and manually importing it back in using the import csv feature within vocalise?


!


Thanks


Rod
Hi @Rod_Pestell


You can add distribution data source in dashboard mapping and can use all the distribution data in any widget. Only things is distribution data starts appearing after mapping the data source in dashboard. If you have launched survey on 1st May but adding data source in dashboard in 5th May then distribution data will start appearing from 5th May. So better to add before launching the survey. Refer below support page -

https://www.qualtrics.com/support/vocalize/widgets/distribution-reporting/


Thanks!

Leave a Reply