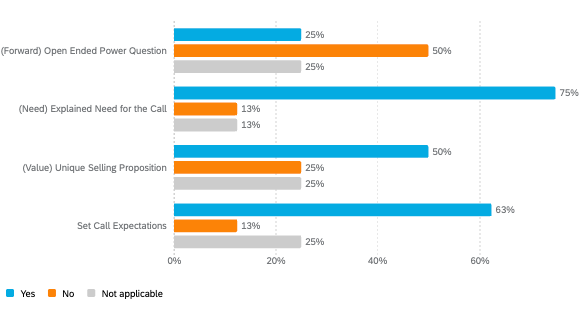
I'm thinking about making a gauge chart that will essentially show the number percentage of the "yes" (pictured in a measure group, I would break this out for each question). I.E. I would have a gauge chart for "(Forward) Open Ended Power Question" and it would show 25%, “(Need) Explained Need for the Call” would show 75%, etc.... What's the best way to do this? Right now I have the question mapped in as a text set.

