I am not a statistician, but at a recent meeting where I was reviewing the results of a survey and the report, I was asked what the confidence level was. Thankfully my manager quickly calculated it. Is there a way to get at a survey's confidence % interval/level without a big scary formula?
Page 1 / 1
Hi Ellen! I'm not sure about the confidence level of the survey, but if you have access to StatsIQ you can quickly get the confidence interval for each metric in the survey. (Select the metrics you are interested in, click "Describe", and then a table that contains confidence interval should pop up as part of the output.) Hopefully this helps!
thanks. I was hoping for an overall confidence level for the whole survey
Google it  It sounds so silly, but even as someone who works with surveys all day every day, it's faster to use some of these online calculators that run the formula myself. This one is my go-to (it's just at the top of Google's results list):
https://www.surveysystem.com/sscalc.htm
A touch of stats 101- A confidence interval is a variable that you set. You know how big your population is, and what your sample size is. And you say, "I want to be 95% sure that the result I report is correct.". You then put in that cofidence interval, and it calculates the _margin of error_ for you.
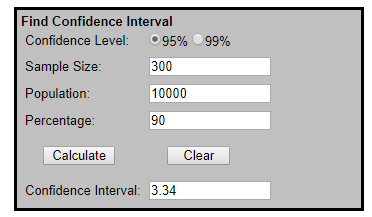
EG: My survey says 90% of my survey-responding customers have seen my most recent ad. My total population of customers is 10,000 people, and I had 300 take the survey. That gives me a margin of error a little over 3%. Therefore, I can be 95% confident that if _ALL _10,000 customers took my survey, between 87-93% of them will have seen my most recent ad.
!
Standard stats is going to use Confidence intervals of 95% or 99%. Simply because you want to be really really sure of something. Even if you're margin of error is large, you can still subtract the margin from your results and make very confdient statements.
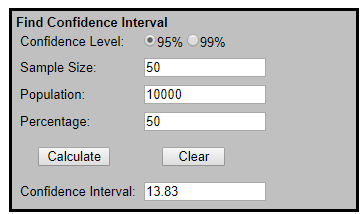
EG: My survey says 90% of my survey-responding customers have seen my most recent ad. My total population of customers is 10,000 people, but this time I had just 50 take the survey. That gives me a margin of error of 14%. Therefore, I can be 95% confident that if _ALL _10,000 customers took my survey, _at least_ 76% of them will have seen my most recent ad.
!
 It sounds so silly, but even as someone who works with surveys all day every day, it's faster to use some of these online calculators that run the formula myself. This one is my go-to (it's just at the top of Google's results list):
 https://www.surveysystem.com/sscalc.htm
A touch of stats 101- A confidence interval is a variable that you set. You know how big your population is, and what your sample size is. And you say, "I want to be 95% sure that the result I report is correct.". You then put in that cofidence interval, and it calculates the _margin of error_ for you.
EG: My survey says 90% of my survey-responding customers have seen my most recent ad. My total population of customers is 10,000 people, and I had 300 take the survey. That gives me a margin of error a little over 3%. Therefore, I can be 95% confident that if _ALL _10,000 customers took my survey, between 87-93% of them will have seen my most recent ad.
!

Standard stats is going to use Confidence intervals of 95% or 99%. Simply because you want to be really really sure of something. Even if you're margin of error is large, you can still subtract the margin from your results and make very confdient statements.
EG: My survey says 90% of my survey-responding customers have seen my most recent ad. My total population of customers is 10,000 people, but this time I had just 50 take the survey. That gives me a margin of error of 14%. Therefore, I can be 95% confident that if _ALL _10,000 customers took my survey, _at least_ 76% of them will have seen my most recent ad.
!

Leave a Reply
Enter your E-mail address. We'll send you an e-mail with instructions to reset your password.
