Calculate Overall NPS score for each department in a bar chart in Report | XM Community
Solved

Calculate Overall NPS score for each department in a bar chart in Report

  • 1 April 2024
  • 1 reply
  • 28 views

Badge +3

Hi,

I need some help in in showing  the NPS score for each dept in a bar chart in my report. I am able to calculate the overall in a guage chart but couldn’t group it for different categories.

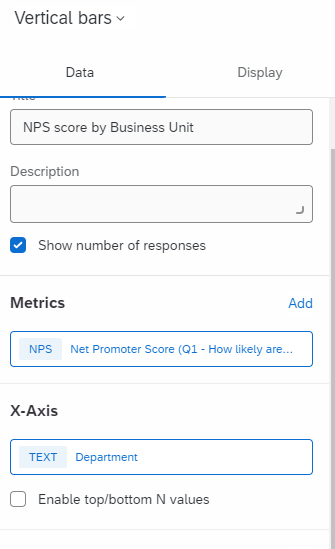
I need to show the data in the following format in my report:


icon

Best answer by omkarkewat 2 April 2024, 11:24

View original

1 reply

Userlevel 5
Badge +12

Hi @Susmitha Vangala, you can select NPS metric and insert the NPS question and then add the ‘Department’ field in the X-axis.

This is how it will look.


Leave a Reply