How to create a breakdown bar joining five parameters in just three. | XM Community
Skip to main content

Hi folks,

                 I have created an IT Survey where I have a lot of question with a scale of Very Dissatisfied to Very Satisfied and I Would like to represent the percentage in three categories negative, neutral and very satisfied…


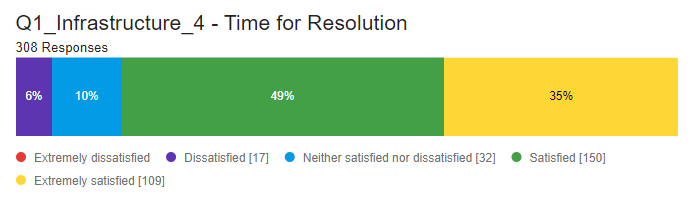
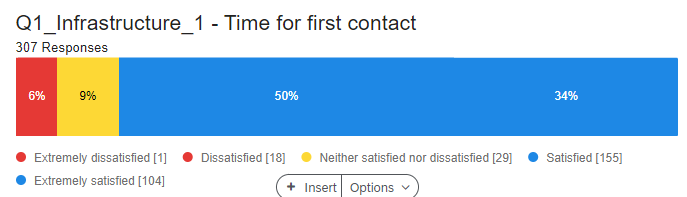
This is the standard breakdown bar.

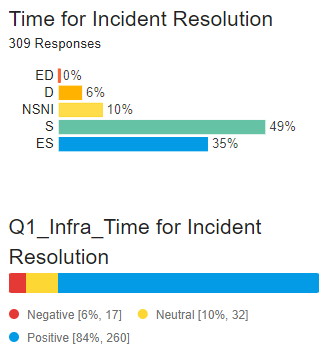
This is how I would like to see the breakdown bar but with the sum of both percentages.

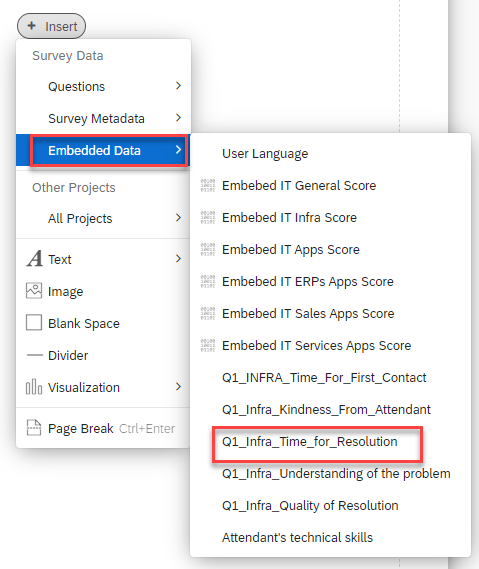
I hope you understand that I would like to do, and you can help me.


Thank you in advance!

@Ierodri If you use dashboard you can use recode editor to merge the field when show it in dashboard:
https://www.qualtrics.com/support/vocalize/dashboard-settings-cx/dashboard-data/recoding-values/

If you’re using report tab like what in the picture, I would recommend using field editor to merge some of the result into a new field and make report out of it: https://www.qualtrics.com/support/survey-platform/data-and-analysis-module/data/add-new-fields/bucketing-variable-creation/ 

Let me know if it helps


Thank you so much!! The second link was perfect to resolve my needed!!! 

This is my before/after report.


Just let me add more information… after to create the new report we need to insert it from Embedded Data 


Thank you again for your help!!


Regards.


@Ierodri Glad it helps 👍


Leave a Reply