In the past Reporting Environment, a chart (e.g., bar chart) could have the results of 2 or more question displayed, as long a scale was the same for all questions added.
I can't figure out how to do this in the new Reporting Environment.
Thanks, Ian

Page 1 / 1
Hello @IanW ,
You can have 2 question in a chart using breakouts. see the image below!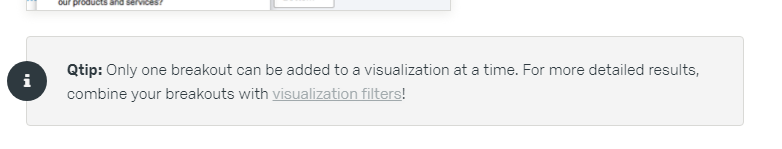
Please see the answers of this post
Also please see this Support page
You can have 2 question in a chart using breakouts. see the image below!
Please see the answers of this post
Also please see this Support page
Hi @IanW
For a scale question , like with 5 statements, yes you can show all in one chart. For this in Field you have to select all choices. While if your statements are coming from different questions than you have to prepare separate chart.
If you are using Vocalize, you can do in one graph using filed and group.
Enter your E-mail address. We'll send you an e-mail with instructions to reset your password.