Graph not showing in Pricing Study (Van Westendorp) Project | XM Community
Skip to main content
Question

Graph not showing in Pricing Study (Van Westendorp) Project


So i've imported about 340 answers into the project in Qualtrics dedicated to do Price Sensitivity Measurement (PSM).
However, when i click "Report", there is no graph showing. Just this error message:
"No data found - your filters may be too exclusive!". Take a look at the attached picture.

Does anyone know what that means? I've cleaned out all the bad values as well.
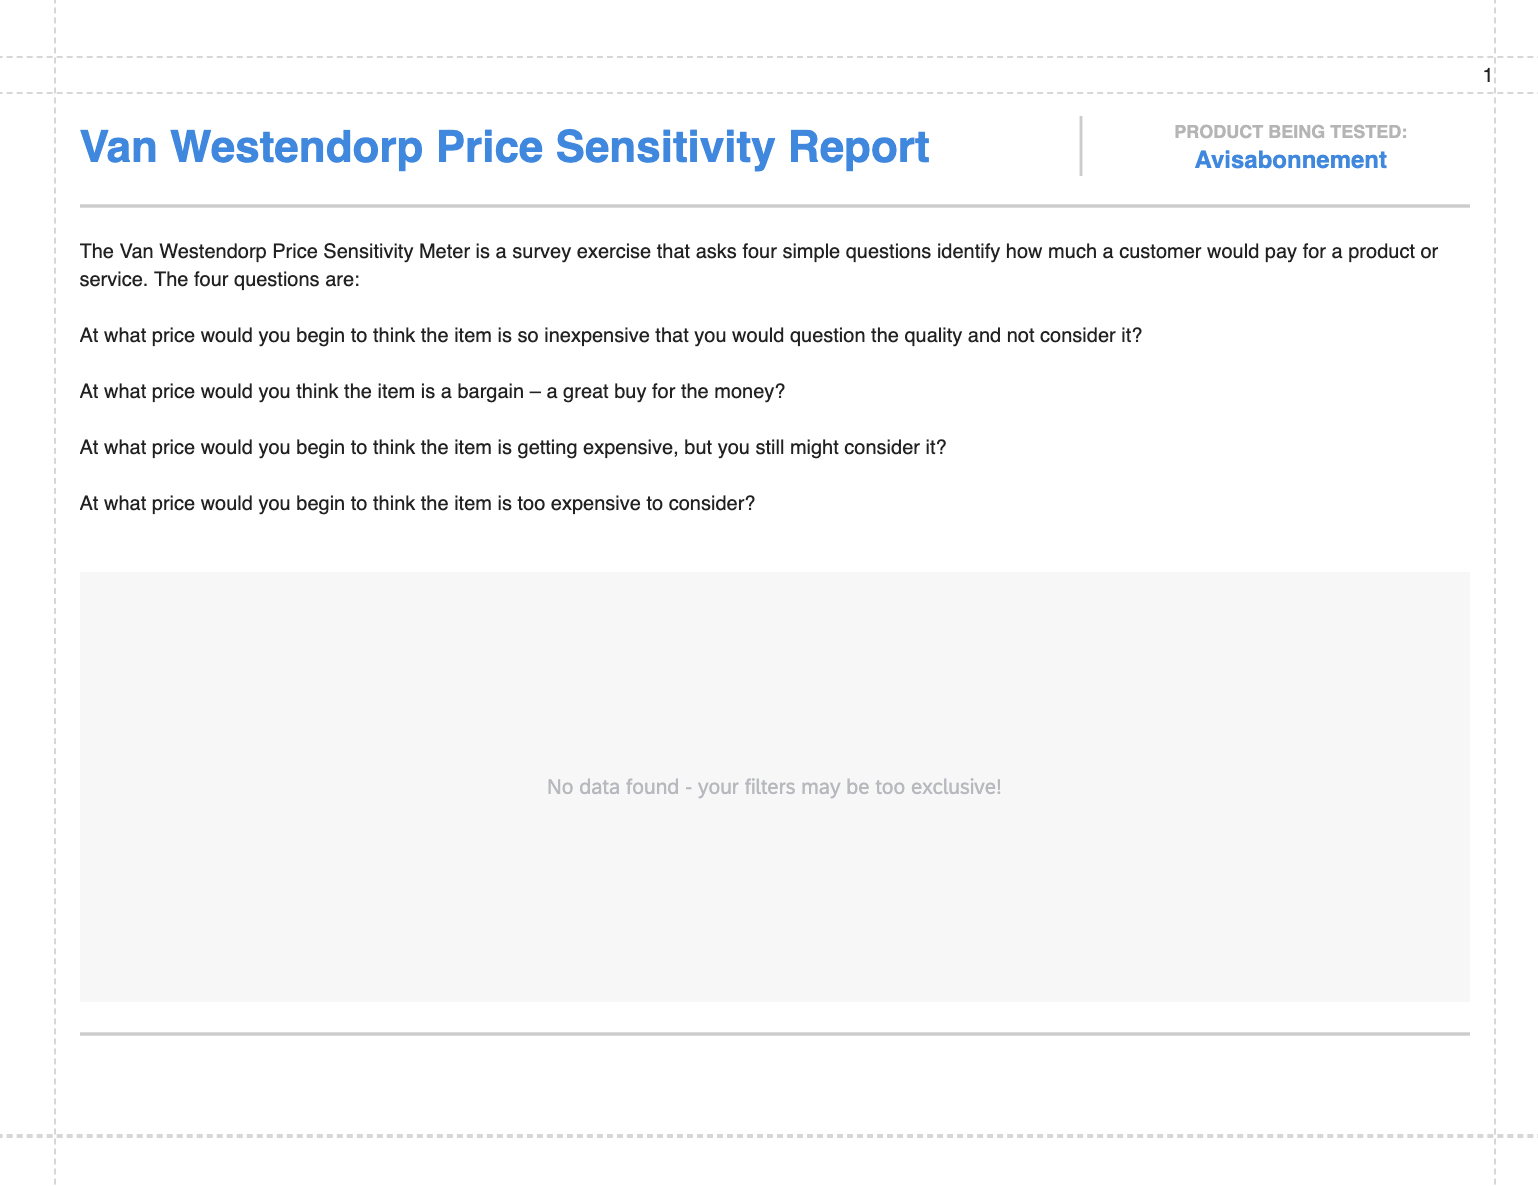
Screenshot 2020-05-26 at 13.50.41.png

3 replies

PraDeepKotian_XM
QPN Level 5 ●●●●●
Forum|alt.badge.img+21

HI OttoJohnen
To show the data in "Price estimator(Van Westendorp)" visualisations we need to have the data in this Pricing data i.e. all 4 below variables
image.png


KimB
Level 1 ●
Forum|alt.badge.img+4
  • Level 1 ●
  • 3 replies
  • February 11, 2021

I'm getting a data error there
image.png


LaurenK
Former XM Community Team Member
Forum|alt.badge.img+13
  • Former XM Community Team Member
  • 900 replies
  • February 24, 2021

Hi KimB - if you are still experiencing this data error after refreshing your account, be sure to reach out to our Support team so they can further troubleshoot this for you!


Leave a Reply