

Hello everyone,
I am trying to use this amazing visual, but it is only available in the Text IQ tab. It is possible to have it in a Dashboard as a Widget? Or at least it is possible to use two change the time periods to have a larger comparison.
Thanks!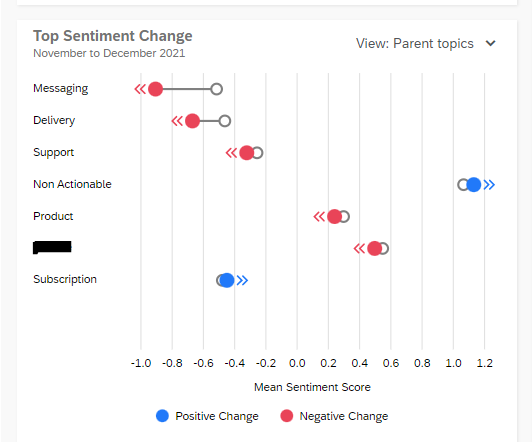

Solved
It is possible to have this (Sentiment Change) visualization in a CX dashboard?
Best answer by InessaG
No, it's not available in exactly this format. You can use the Text iQ Table widget to get at the data points behind this in a different format.


Leave a Reply
Enter your E-mail address. We'll send you an e-mail with instructions to reset your password.