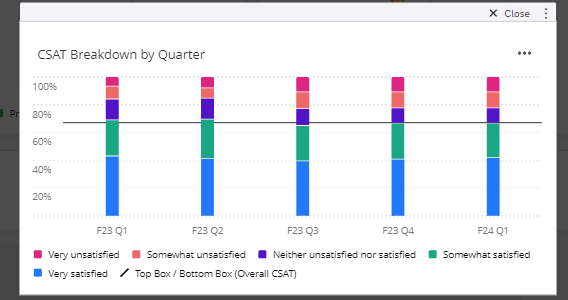
I would like to create a chart like the one below where the line is the CSAT score for that quarter, comparing the breakdown and the overall score. Currently, the comparison line will only show the current CSAT score instead of changing with the associated survey date (quarter). Has anyone else accomplished this a comparison where the line matches the x-axis date?