Dashboard - compare 2 data sources between each other | XM Community
Question

Dashboard - compare 2 data sources between each other

  • 19 January 2024
  • 11 replies
  • 147 views

Userlevel 3
Badge +3

Hello everyone,

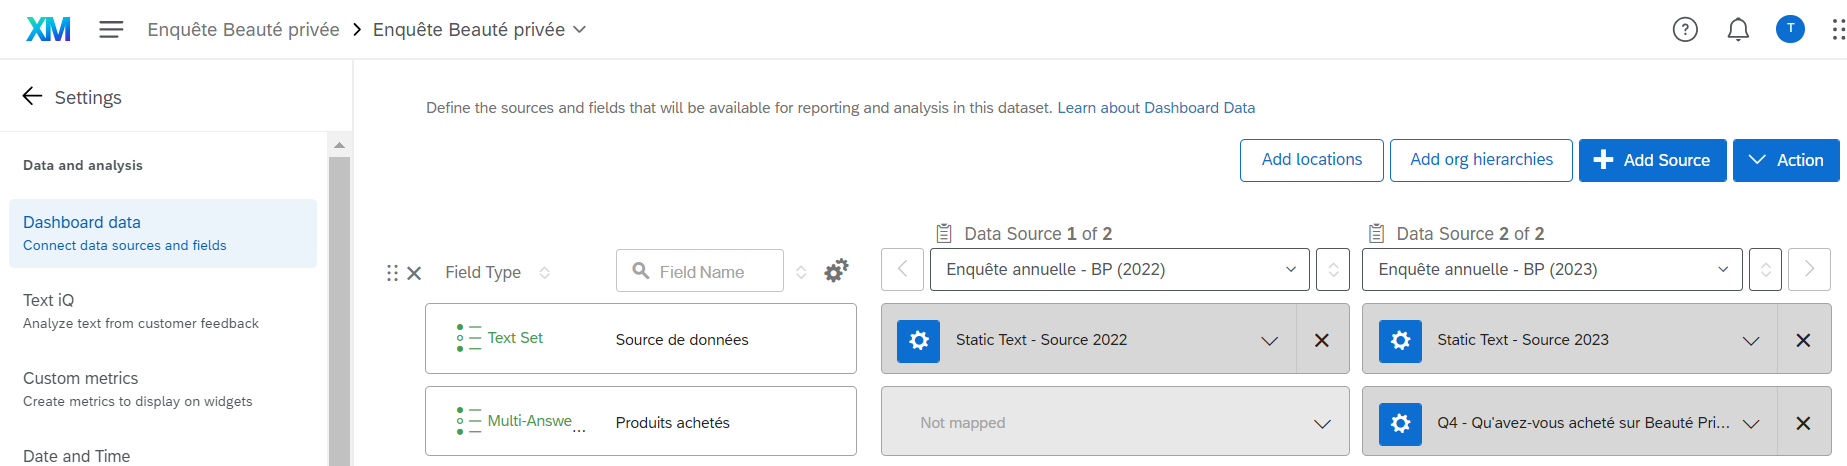
I am currently working on creating a dashboard, we have an annual survey that we launch every year at the end of the year. I would like to compare my 2022 datas to my 2023 datas. When I mapp the datas in dashboard data in order to make my questions coincide when I create a widget because the items are the same from a year to another the data merges and I would like to have them seperated how can I do this ? 

Can someone please help ? 

Regards,

Tata


11 replies

Userlevel 5
Badge +20

Hey @Tata C ,

I am assuming there will be a date / Year filed in your dataset. Try adding that on X Axis and you should be able to see the required comparisons. 

Do give it a try

Userlevel 3
Badge +3

Hello @Swanand_Chavan_Ugam 


Thanks for your answer I created a Text Set and mapp it as Static Text :

  • 2022 source 
  • 2023 source

Is that right ? 

Can you please tell me with which type of widget I’ll be able to have my question and compare 2022 and 2023 answers ? 


Regards,

Tata

Userlevel 5
Badge +20

Can you share some snapshots of what you have done in the data file? 

With regards to the widget type - it will be Bar or Line Chart. 

Userlevel 3
Badge +3

@Swanand_Chavan_Ugam 

Find below a screenshot of what I did. I have the same questions from one year to another and I would like to compare the results but in widget it seems like I can’t have the distinction between my 2022 and 2023 responses.


Userlevel 4
Badge +23

You can use data resource as a filter and variable  in the widget, like in graph select the question and apply variable of data resource on X axis.

Userlevel 5
Badge +20

Hello @Tata C ,


Thanks for sharing the snapshot, as you have 2 different sources which are mapped in the same dashboard, Qualtrics gives you an option to add “Data Set Source” as a option to add on the X Axis.


This hidden field can be used for applying filters on page level too. Do try it once

Userlevel 3
Badge +3

Hi @Swanand_Chavan_Ugam 

Take a look at the screnshot below. I don’t see now X-axis option in my widget options 

Do you know why ? 


Userlevel 5
Badge +20

Here I am assuming same question is available in both of your surveys.

You can add the “Data Set Source” in Data Series...see if you are able to do that. I believe that should work 

Userlevel 3
Badge +3

@Swanand_Chavan_Ugam 

I can see that my datas are filtered on 2023 data set source thanks

How can I have both of my sources to compare them with one another please ? 

Userlevel 5
Badge +20

@Tata C ,

In the dashboard mapping snapshot you shared, I noticed that Q4 question is not available in 2022 source. If you map that question then only you would be able to see.

Re-sharing the same snapshot


Userlevel 3
Badge +3

@Swanand_Chavan_Ugam 


Yes, I tried to create widgets following the mapping of my questions but because some responses items are the same from one year to another there is no distinction beteween the items, they merge. Do you know how can I have them all seperated ? 

Regards, 

Tata

Leave a Reply