Display a graph of survey results to participants | XM Community
Skip to main content
Solved

Display a graph of survey results to participants

  • May 24, 2023
  • 4 replies
  • 338 views

Forum|alt.badge.img+2

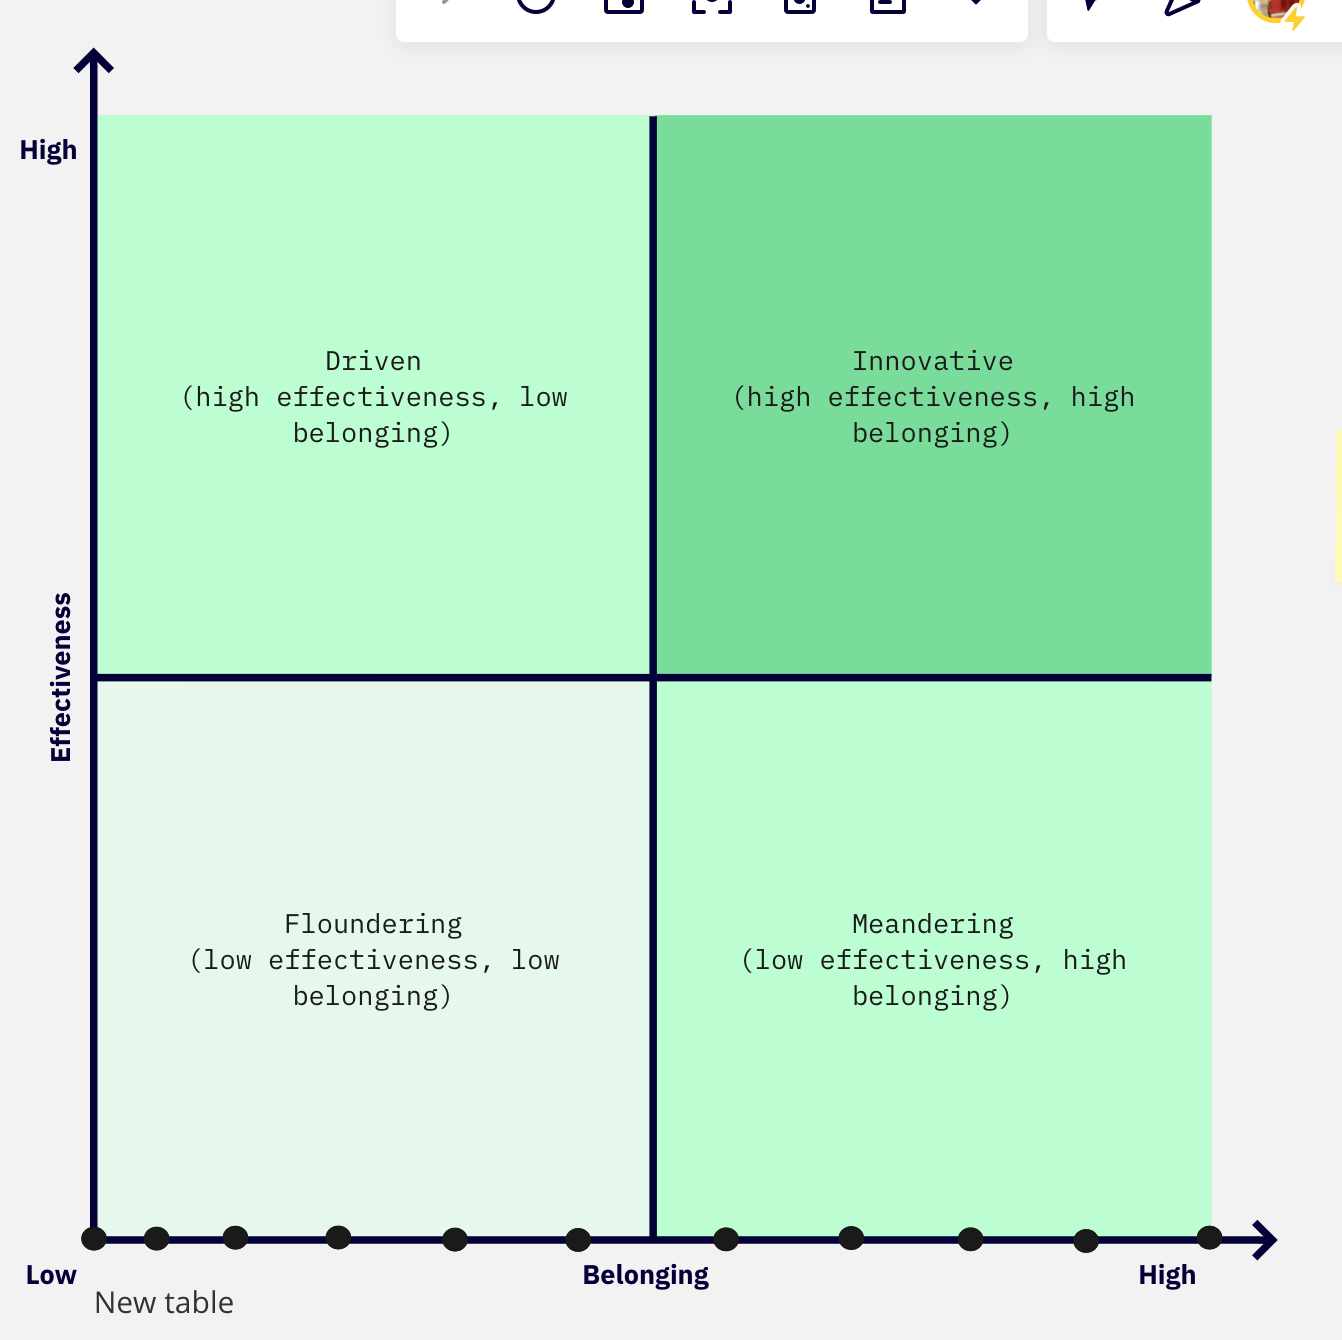
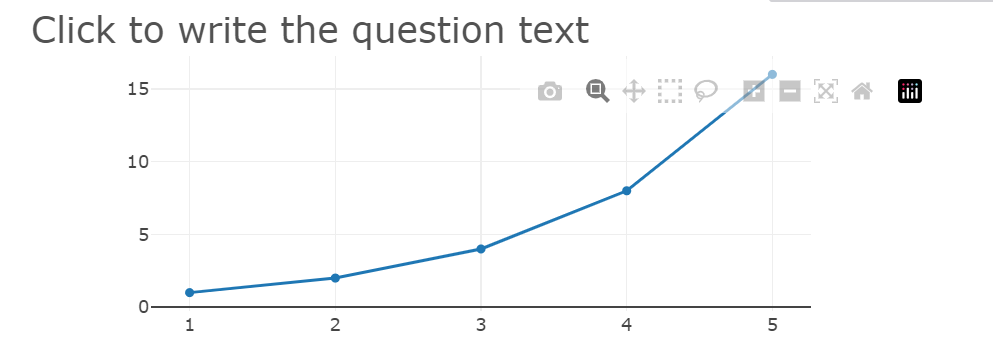
We are creating a teamwork assessment task in Qualtrics. Individual respondents rate their team on a number of items that are tagged as either contributing to qualityA or qualityB of the group work. We have set up scoring so that respondents receive a score of 0 to 50 on each of these dimensions. We have created a summary page using the Text/Graphic question type on which the respondents receive their scores. We also want to include on this page a graph like the one below, showing where they rated on the scale.

I am looking for recommendations and ideas to make this work. I have been looking at us Javascript. Unfortunately, you cannot call on script libraries from within the HTML editor. I have been looking at the Javascript option in Qualtrics, but I am unsure of how to call on libraries, such as Plotly.js from within the script editor. Any ideas or recommendation are much appreciated.


Best answer by Deepak

@dbporter 

Navigate to your look and feel → General → Header and click on source icon you should be able to save it.

I was able to get this output.


4 replies

Deepak
QPN Level 8 ●●●●●●●●
Forum|alt.badge.img+46
  • 1555 replies
  • May 24, 2023

@dbporter 

This page should help you.

The source goes in header within your look and feel >source.

Rest you can use plotly as required.


Forum|alt.badge.img+2
  • Author
  • Level 1 ●
  • 2 replies
  • May 24, 2023

@Deepak,

Thanks for that. However, for the Text/Graphic question in Qualtrics, you cannot into a head tag. The software strips it out on save.


Deepak
QPN Level 8 ●●●●●●●●
Forum|alt.badge.img+46
  • 1555 replies
  • Answer
  • May 24, 2023

@dbporter 

Navigate to your look and feel → General → Header and click on source icon you should be able to save it.

I was able to get this output.


Forum|alt.badge.img+2
  • Author
  • Level 1 ●
  • 2 replies
  • May 24, 2023

@Deepak 

You are a rock star! That worked!

I was able to use Plotly to add the graph and insert the piped text for my variables into the javascript and have it plot for the participants.

Thanks so much.