I have a basic account and I am trying to create a new field that can be used in a Pie Chart of all the "Total Initiatives" each department is pursuing or focused on achieving.
I am trying to make this pie chart so I can include it in a report. The initial survey was created by someone else. The survey questions are multiple choice with recoded values. The multiple choice question asks each department where they are it with their initiative: "No Action Yet", "Planning", "Initiating", "Completed", and "Completed & Going".: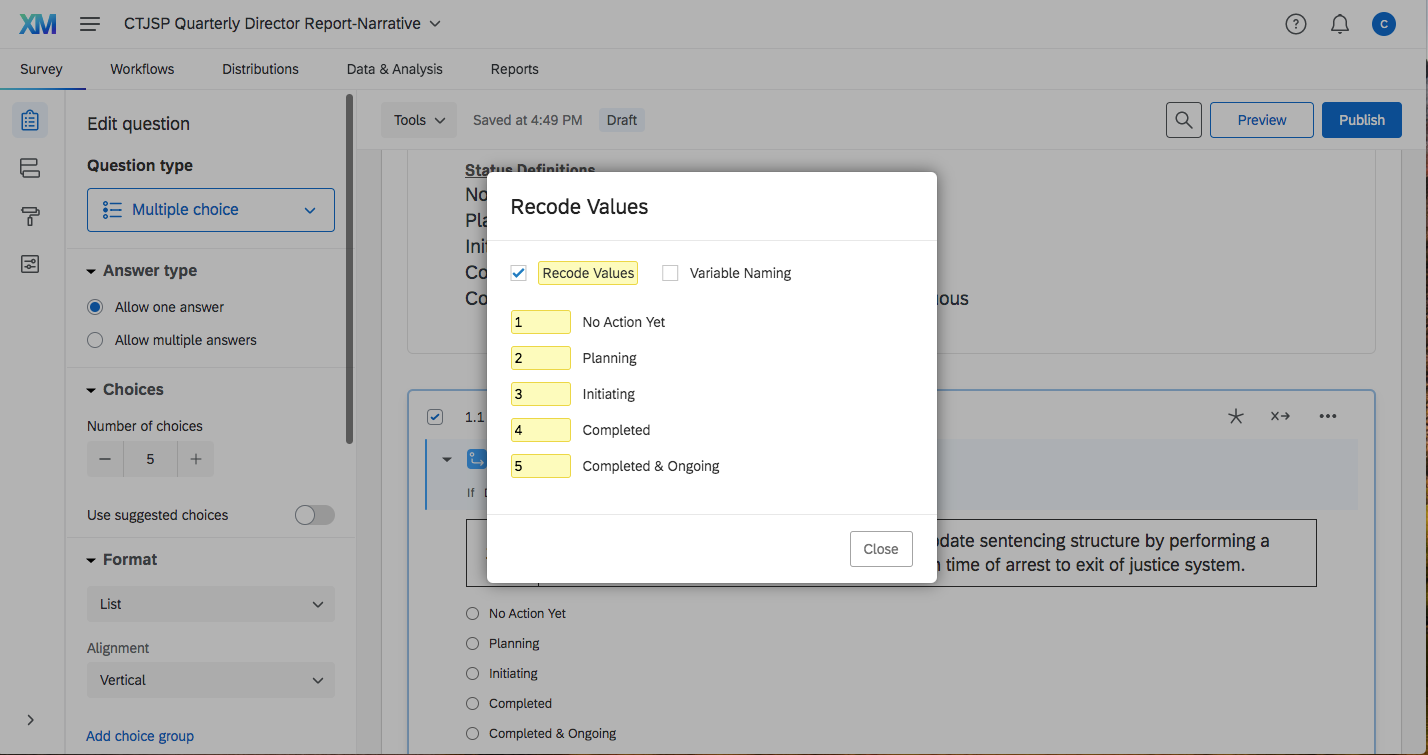 I want to have a pie chart that can show the number of initiatives each department is focused on and/or also showing the percentage of the "Total Initiatives" each department is responsible for.
There are only 5 departments, so there are only 5 survey responses, but there are ~68 total initiatives. As you can see in the screenshot below, I created a New Field (Numeric) and had manually input the totals (yellow box outline). I also made scores for each "initiative status", which they can be seen below just to the right of the New Field. I used this to mentally add up the initiatives for each department and manually entered the number into the new field: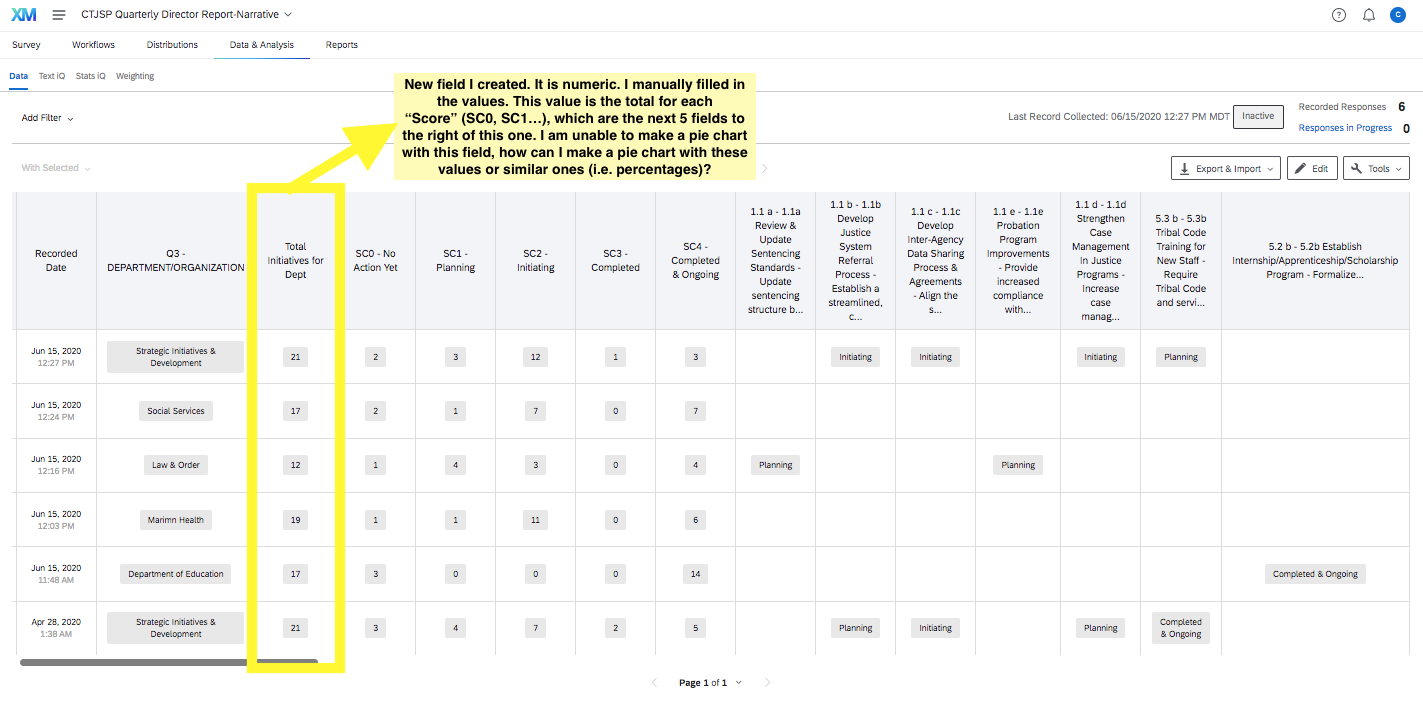
Here is a view of my report with a pie chart I made that basically shows how many departments there are, incase this helps clear up what I am trying to do: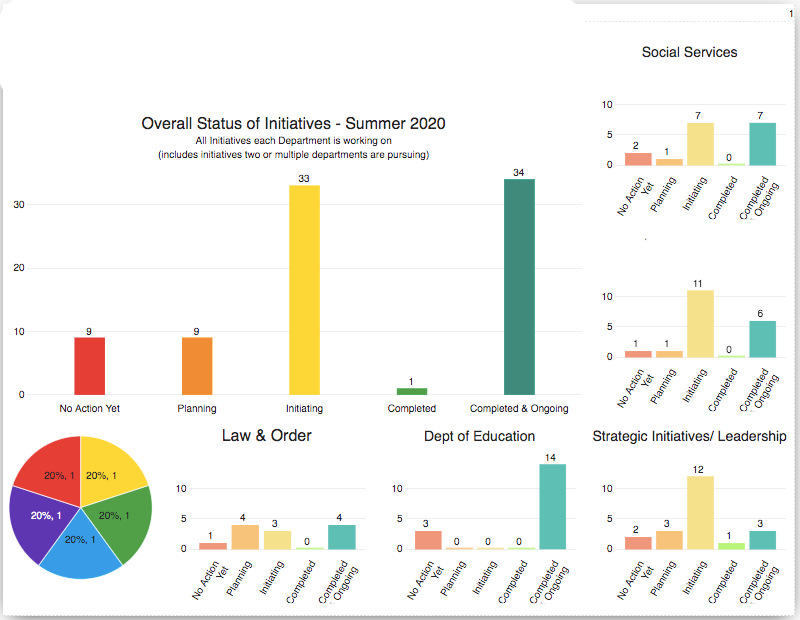
Again, I am unable to make a pie chart with that New Field. Does anyone know how I could create a new field that can be used with a Pie Chart showing the "Total Initiatives" number and/or the "Total Initiatives" percentage breakdown each department is responsible for?

How to create a new field that can then be used in a pie chart?
Sign up
Already have an account? Login

Welcome! To join the Qualtrics Experience Community, log in with your existing Qualtrics credentials below.
Confirm your username, share a bit about yourself, then you're ready to explore and connect .
Free trial account? No problem. Log in with your trial credentials to join.
No free trial account? No problem! Register here
Already a member? Hi and welcome back! We're glad you're here 🙂
You will see the Qualtrics login page briefly before being taken to the Experience Community.
Login with Qualtrics
Welcome! To join the Qualtrics Experience Community, log in with your existing Qualtrics credentials below.
Confirm your username, share a bit about yourself, then you're ready to explore and connect .
Free trial account? No problem. Log in with your trial credentials to join. No free trial account? No problem! Register here
Already a member? Hi and welcome back! We're glad you're here 🙂
You will see the Qualtrics login page briefly before being taken to the Experience Community.
Login to the Community
No account yet? Create an account
Welcome! To join the Qualtrics Experience Community, log in with your existing Qualtrics credentials below.
Confirm your username, share a bit about yourself, then you're ready to explore and connect .
Free trial account? No problem. Log in with your trial credentials to join.
No free trial account? No problem! Register here
Already a member? Hi and welcome back! We're glad you're here 🙂
You will see the Qualtrics login page briefly before being taken to the Experience Community.
Login with Qualtrics
Welcome! To join the Qualtrics Experience Community, log in with your existing Qualtrics credentials below.
Confirm your username, share a bit about yourself, then you're ready to explore and connect .
Free trial account? No problem. Log in with your trial credentials to join. No free trial account? No problem! Register here
Already a member? Hi and welcome back! We're glad you're here 🙂
You will see the Qualtrics login page briefly before being taken to the Experience Community.
Enter your E-mail address. We'll send you an e-mail with instructions to reset your password.