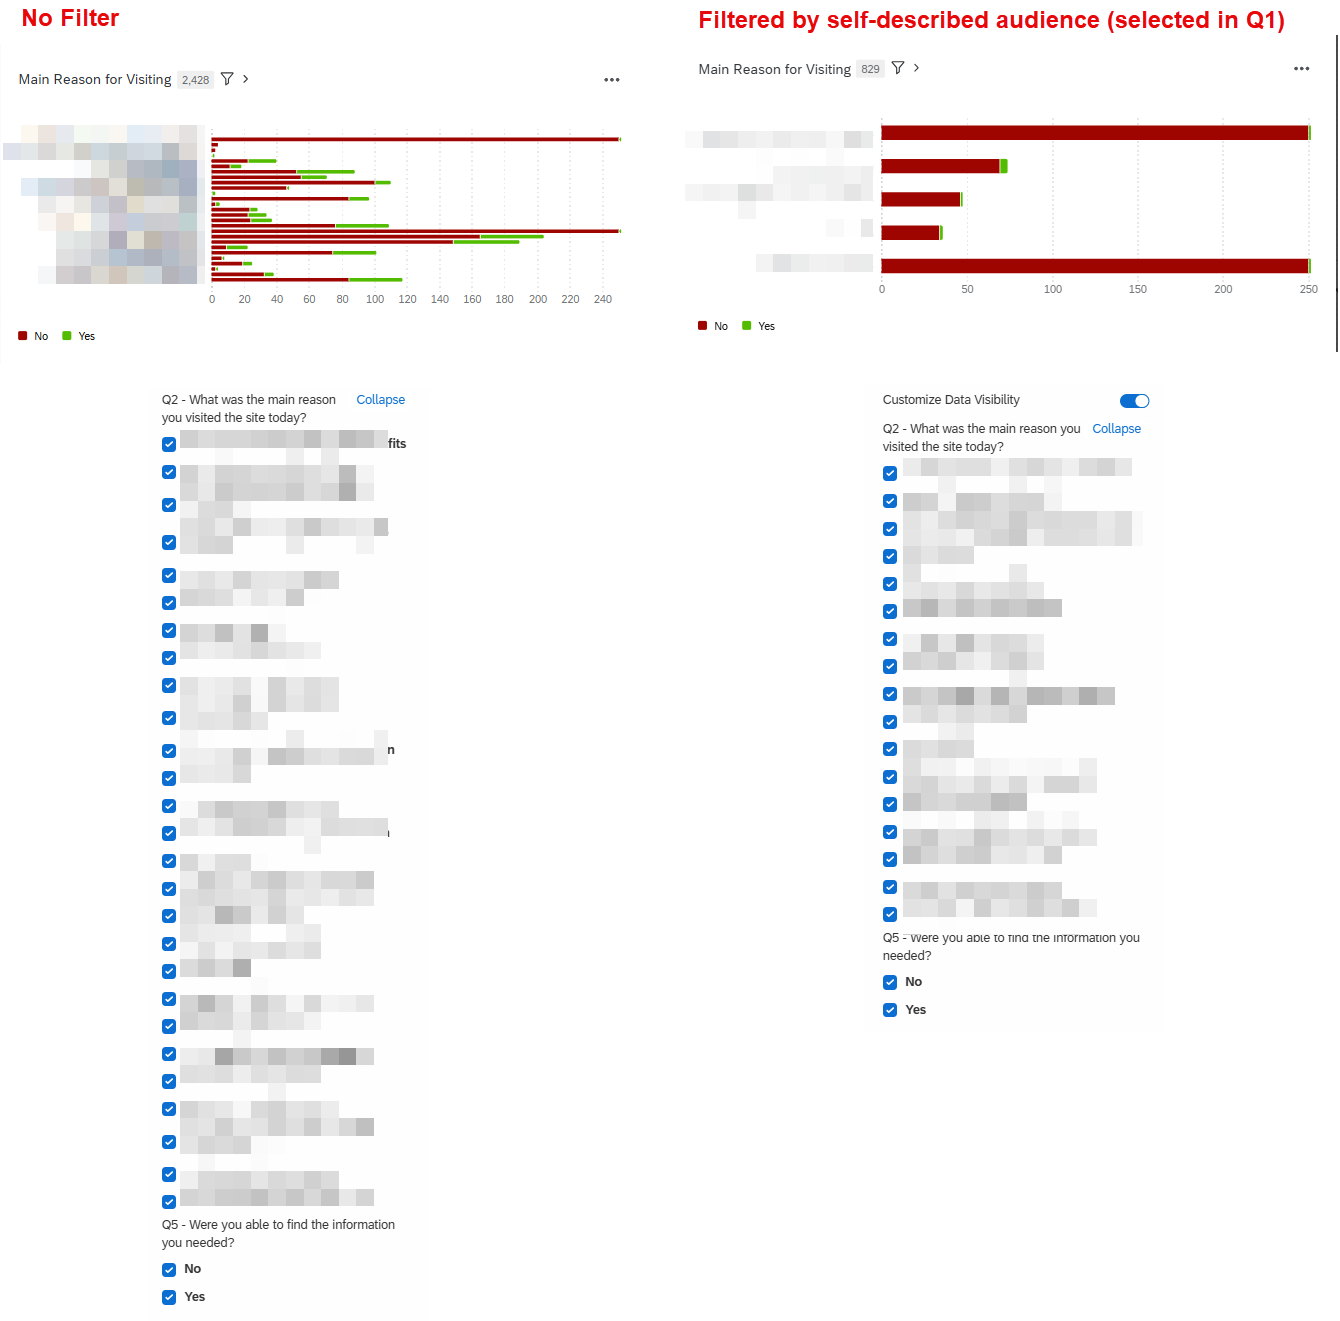
I’m trying to create a table lens like display in a dashboard. But I’m hitting a snag because when I try to add a bar chart, it only displays fields with non-zero values. Anyone know how I can get around this?
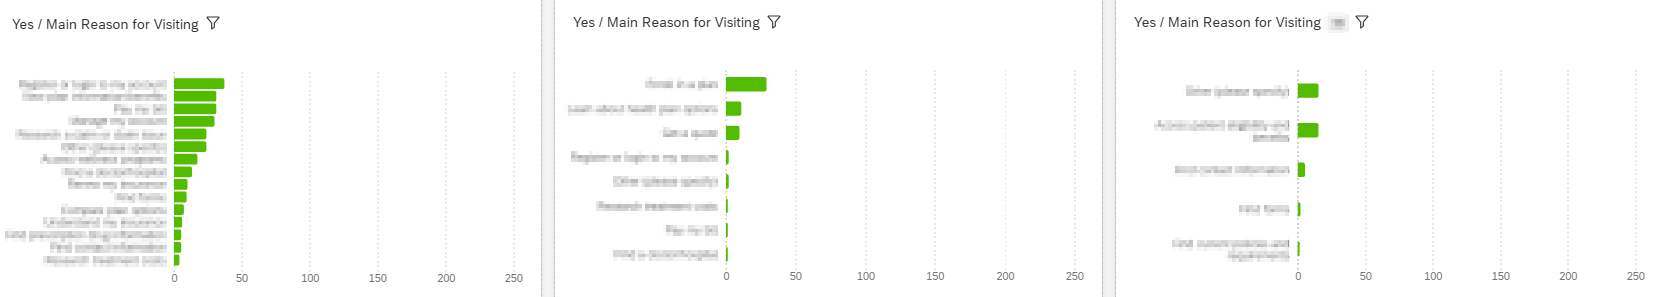
To add some detail: The three bar charts are different audiences. The bars represent the reason they indicated they visited the site. I want the bars to line up across all of the chart so it’s easy to compare why different audiences visited, but only the non-zero responses are showing. If it worked how I want, every chart would have the same dozen-ish rows (but most with zero values.) Any way around this?
Thanks!!