
I want to show a daily cumulative number of the survey responses (total responses until each day in the list)? whether in a table or a chart..
E.g. if Feb 1st = 100 responses, Feb 2nd = 50 responses, Feb 3rd = 100 repsonses, I want to show it as
Feb 1st cum =100, Feb 2nd cum= 150, Feb 3rd cum= 250.
Similarly for the NPS, are there any of these options??
Thanks!

Solved
Is there any way in the dashboard to display a daily cumulative number of responses and NPS?
Best answer by CMurph
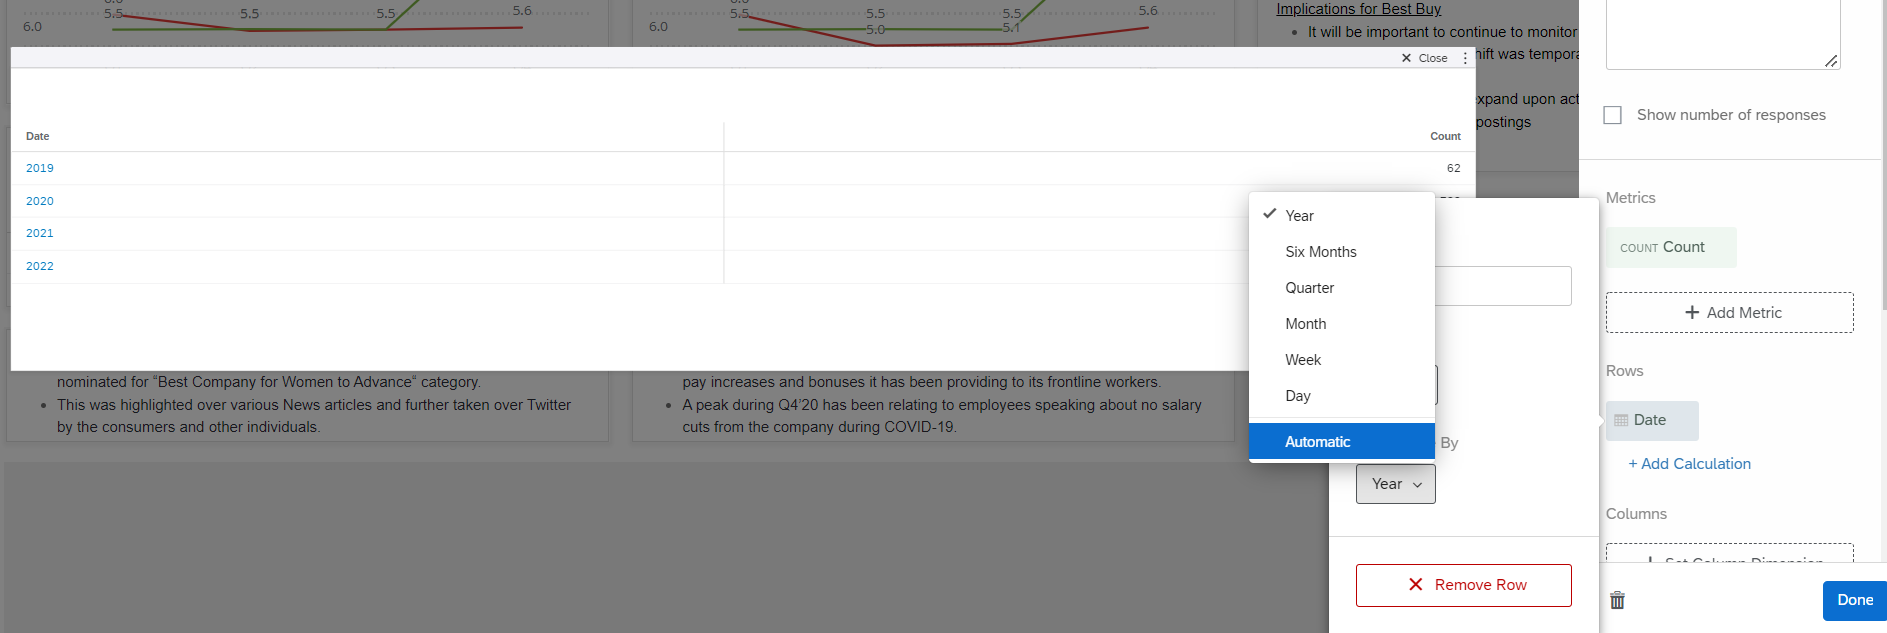
https://community.qualtrics.com/XMcommunity/discussion/comment/43994#Comment_43994This will show each day's count, but doesn't allow for a cumulative calculation. I'm not sure I'm aware of a way to do that Abeer_Ahmed without a lot of manual effort. For instance, if you create a simple chart or table and add count metrics for the number of days you want to track and then filter each count metric on a date. Say you want to track 7 days of data, so you add 7 count metrics. For each metric, you could use a date filter and set a specific time frame/date range on each metric. So count metric 1 would be from 2/1 to 2/1, then count metric 2 from 2/1-2/2, then count metric 3 from 2/1-2/3 and so on. I think this would apply for NPS, as well.
Obviously, this is something that would require ongoing manual updating, which is likely not helpful if you have a survey the runs continuously. I'm just not sure I've seen a way to set it up the way you've mentioned. I know Qualtrics has data or dashboard engineers that can build custom widgets for you - maybe that's an option?


Leave a Reply
Enter your E-mail address. We'll send you an e-mail with instructions to reset your password.