Part II – What exactly is Text iQ?
Part I is here: https://community.qualtrics.com/XMcommunity/discussion/18012/text-iq-sucks-but-other-than-that-qualtrics-is-great-part-1/p1?new=1
Qualtrics’ Bread and Butter is retail
The core market for Qualtrics is retail (although there is much more). Even in their video about Text iQ (https://www.qualtrics.com/iq/text-iq/), they're mostly talking about retail. In a retail environment, survey questions remain stable (for long-term trends), and customer feedback is typically short and sweet, and easy to "topic'ize" and identify the sentiment.
The natural language model is clunky in my opinion
The model of the industry typically is to categorize comments into topics and sub-topics, with associated sentiment (positive, negative, neutral, mixed). Specifically with Text iQ you get a score for the intensity of the sentiment (-10 to 10), and even the polarity of the comment (how mixed is the sentiment, from 0 to 10), for both the overall topic as well as the sub-topics.
It’s clunky because, to me, it’s basically a Word cloud of everything (although the actual Word Cloud is a nice output). And I spend most of my time telling the software what words to clump together. One reason for this is that the software doesn’t know jargon, acronyms, nor our users. Plus, as mentioned above, any AI system has difficulty with misspellings, such as comeradery.
With Text iQ, it would take me approximately one day per comments question to get it right, but I would still tell the sponsor they needed to review every comment closely for best assessment. With my manual assessment, it’s about the same amount of time, but at the end I have a deliverable (two screen shots below).
Here’s one of the key outputs of Text iQ – a really cool bubble graphic … but for our purposes it's not really helping ...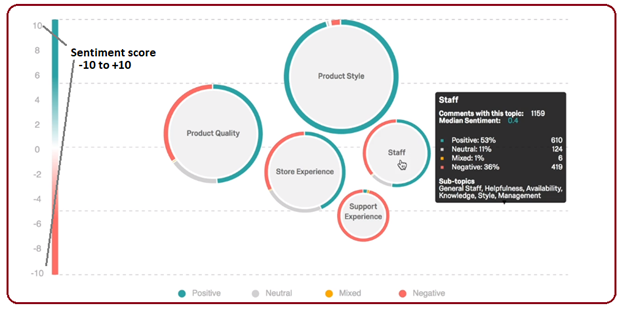 As you can see by the topics, it’s geared toward retail. This can be actionable for a store or a restaurant. But for us, even if the topics and sentiment were accurate (e.g., “Leadership”), it’s not going to be actionable unless the comments are read by a human and categorized to be more specific.
I feel our manual assessment is 10,000x better than Text iQ
My method is tedious but I feel it’s far more effective. So I read each comment closely and identify 1-6 categories per comment, then summarize the categories (done in Excel). I don't want to bog down this post with specifics, so contact me if you would like some tips. The end result is categorized comments with the # of responses for each category (just below), not a bubble chart. It’s perfect for a bar chart, or even a pie chart … but when you get right down to it, this data table tells the story quite clearly. The end result of my manual analysis is a deliverable (screenshot above) that should be shared far and wide. Then you can complement this output by picking off 5-10 important comments for the final report.
Ok, I realize the computer is more efficient than the human – except for College Admissions
As a software development person, I realize the computer has to be relied on at massive scale, and ultimately, it's better and certainly more efficient (if programmed right, obviously). But here’s an example that supports my approach: College Admissions staff don’t rely on the computer – they CAREFULLY read all recommendations by teachers, coaches, and guidance counselors, and manually grade it.
For statistical analysis, Qualtrics Stats iQ is a lot easier to use than IBM SPSS
I wrestled with SPSS for 2 years, but then found I can do things much quicker with Qualtrics for quantitative data using their statistical component, Stats iQ. SPSS is great but it’s overkill for our environment. Qualtrics has been a great addition, and now I use SPSS for only 1 job, twice a year. You have to be a statistician / researcher to effectively use SPSS, but Qualtrics brings statistical analysis to your average IT person, with little training required.
It's all about managing expectations – with Qualtrics Stats iQ, you just “press the button”
My expectation was to press the button in Text iQ and get the answer, much as you can do with Stats iQ. But my expectations quickly went unmet - I spent many hours wrangling with Text iQ just to get proper topics, then I then still recommended to the sponsor that all comments should be reviewed carefully.
Using Text iQ, my average was 1 question per day, regardless of the overall number of comments. If you have 5 comments questions, that’s 5 days, but still, the hard work of reading the comments remained, since the Text iQ solution was simply topics and sentiment, and even that wasn’t so great.
As a comparison (and why we like Stats iQ), I can compare (relate) many, many variables to one key variable (e.g., Gender), and Qualtrics zips through the data while I take a sip of coffee. My only job is to press the button (after tagging all the variables to relate). By the time I take one sip, Qualtrics has completed the analysis.
Here’s a sample result from Stats iQ – there’s all manner of helpful tips and it should satisfy the itch of any statistician. It only took 5 minutes to compare 20 variables to one key variable.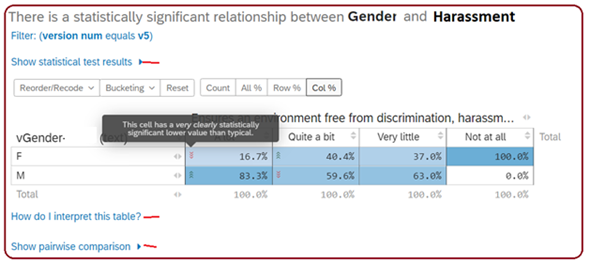 But with text analysis (Text iQ), it’s not push the button, it’s more like a wrestling match with words and phrases, and as I keep re-iterating, you still have to review the comments carefully.
While I’m here – some tips for open text questions in Surveys
- Consider breaking up a question like “Comments on our program” into two questions – “what did you like best?” and “what did you like the least?” This top-side categorization does wonders for the analysis, and I personally think it stimulates the respondent to a richer response.
- Limit the number of open-text questions
- The most important result of the survey is not the results per se, but the widest distribution of the results to as many people as reasonably possible, not just to the primary stakeholders.
Final thoughts
I’d love to hear what you think – I’m relatively new to natural language processing, but I did speak to TWO experts in this area, and both said “Well, that’s about as good as it gets.”
Now, if only Qualtrics or someone could automate my approach – that would be awesome. My model is pretty simple: 1 comment has many categories. Then provide two consumables – the data chart here and then the ability to pick a category and view all of the associated comments.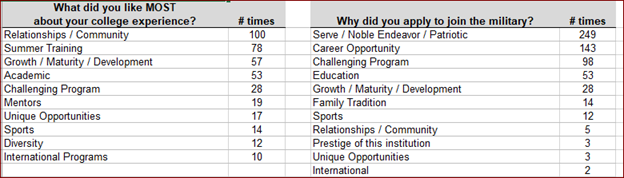
If you made it this far, I've created another article on my idea to automate my manual process. It would still be a manual assessment of qualitative data, but the process would be automated, allowing the manual categorization to be more efficient.
Modify Text iQ to allow for better manual categorization of qualitative data — Qualtrics Community
End

Text iQ is pretty lame, but we love Qualtrics (Part II)
 +8
+8
Sign up
Already have an account? Login

Welcome! To join the Qualtrics Experience Community, log in with your existing Qualtrics credentials below.
Confirm your username, share a bit about yourself, then you're ready to explore and connect .
Free trial account? No problem. Log in with your trial credentials to join.
No free trial account? No problem! Register here
Already a member? Hi and welcome back! We're glad you're here 🙂
You will see the Qualtrics login page briefly before being taken to the Experience Community.
Login with Qualtrics
Welcome! To join the Qualtrics Experience Community, log in with your existing Qualtrics credentials below.
Confirm your username, share a bit about yourself, then you're ready to explore and connect .
Free trial account? No problem. Log in with your trial credentials to join. No free trial account? No problem! Register here
Already a member? Hi and welcome back! We're glad you're here 🙂
You will see the Qualtrics login page briefly before being taken to the Experience Community.
Login to the Community
No account yet? Create an account
Welcome! To join the Qualtrics Experience Community, log in with your existing Qualtrics credentials below.
Confirm your username, share a bit about yourself, then you're ready to explore and connect .
Free trial account? No problem. Log in with your trial credentials to join.
No free trial account? No problem! Register here
Already a member? Hi and welcome back! We're glad you're here 🙂
You will see the Qualtrics login page briefly before being taken to the Experience Community.
Login with Qualtrics
Welcome! To join the Qualtrics Experience Community, log in with your existing Qualtrics credentials below.
Confirm your username, share a bit about yourself, then you're ready to explore and connect .
Free trial account? No problem. Log in with your trial credentials to join. No free trial account? No problem! Register here
Already a member? Hi and welcome back! We're glad you're here 🙂
You will see the Qualtrics login page briefly before being taken to the Experience Community.
Enter your E-mail address. We'll send you an e-mail with instructions to reset your password.