Best practice question labels for auto-mapping in dashboards | XM Community
Question

Best practice question labels for auto-mapping in dashboards

  • 17 August 2023
  • 15 replies
  • 403 views

Userlevel 6
Badge +12

Hi Community! What are the best practices when it comes to question labels? We have many CX Dashboards, Survey templates and Data Projects, so I need to optimize the labels for export and auto-mapping.

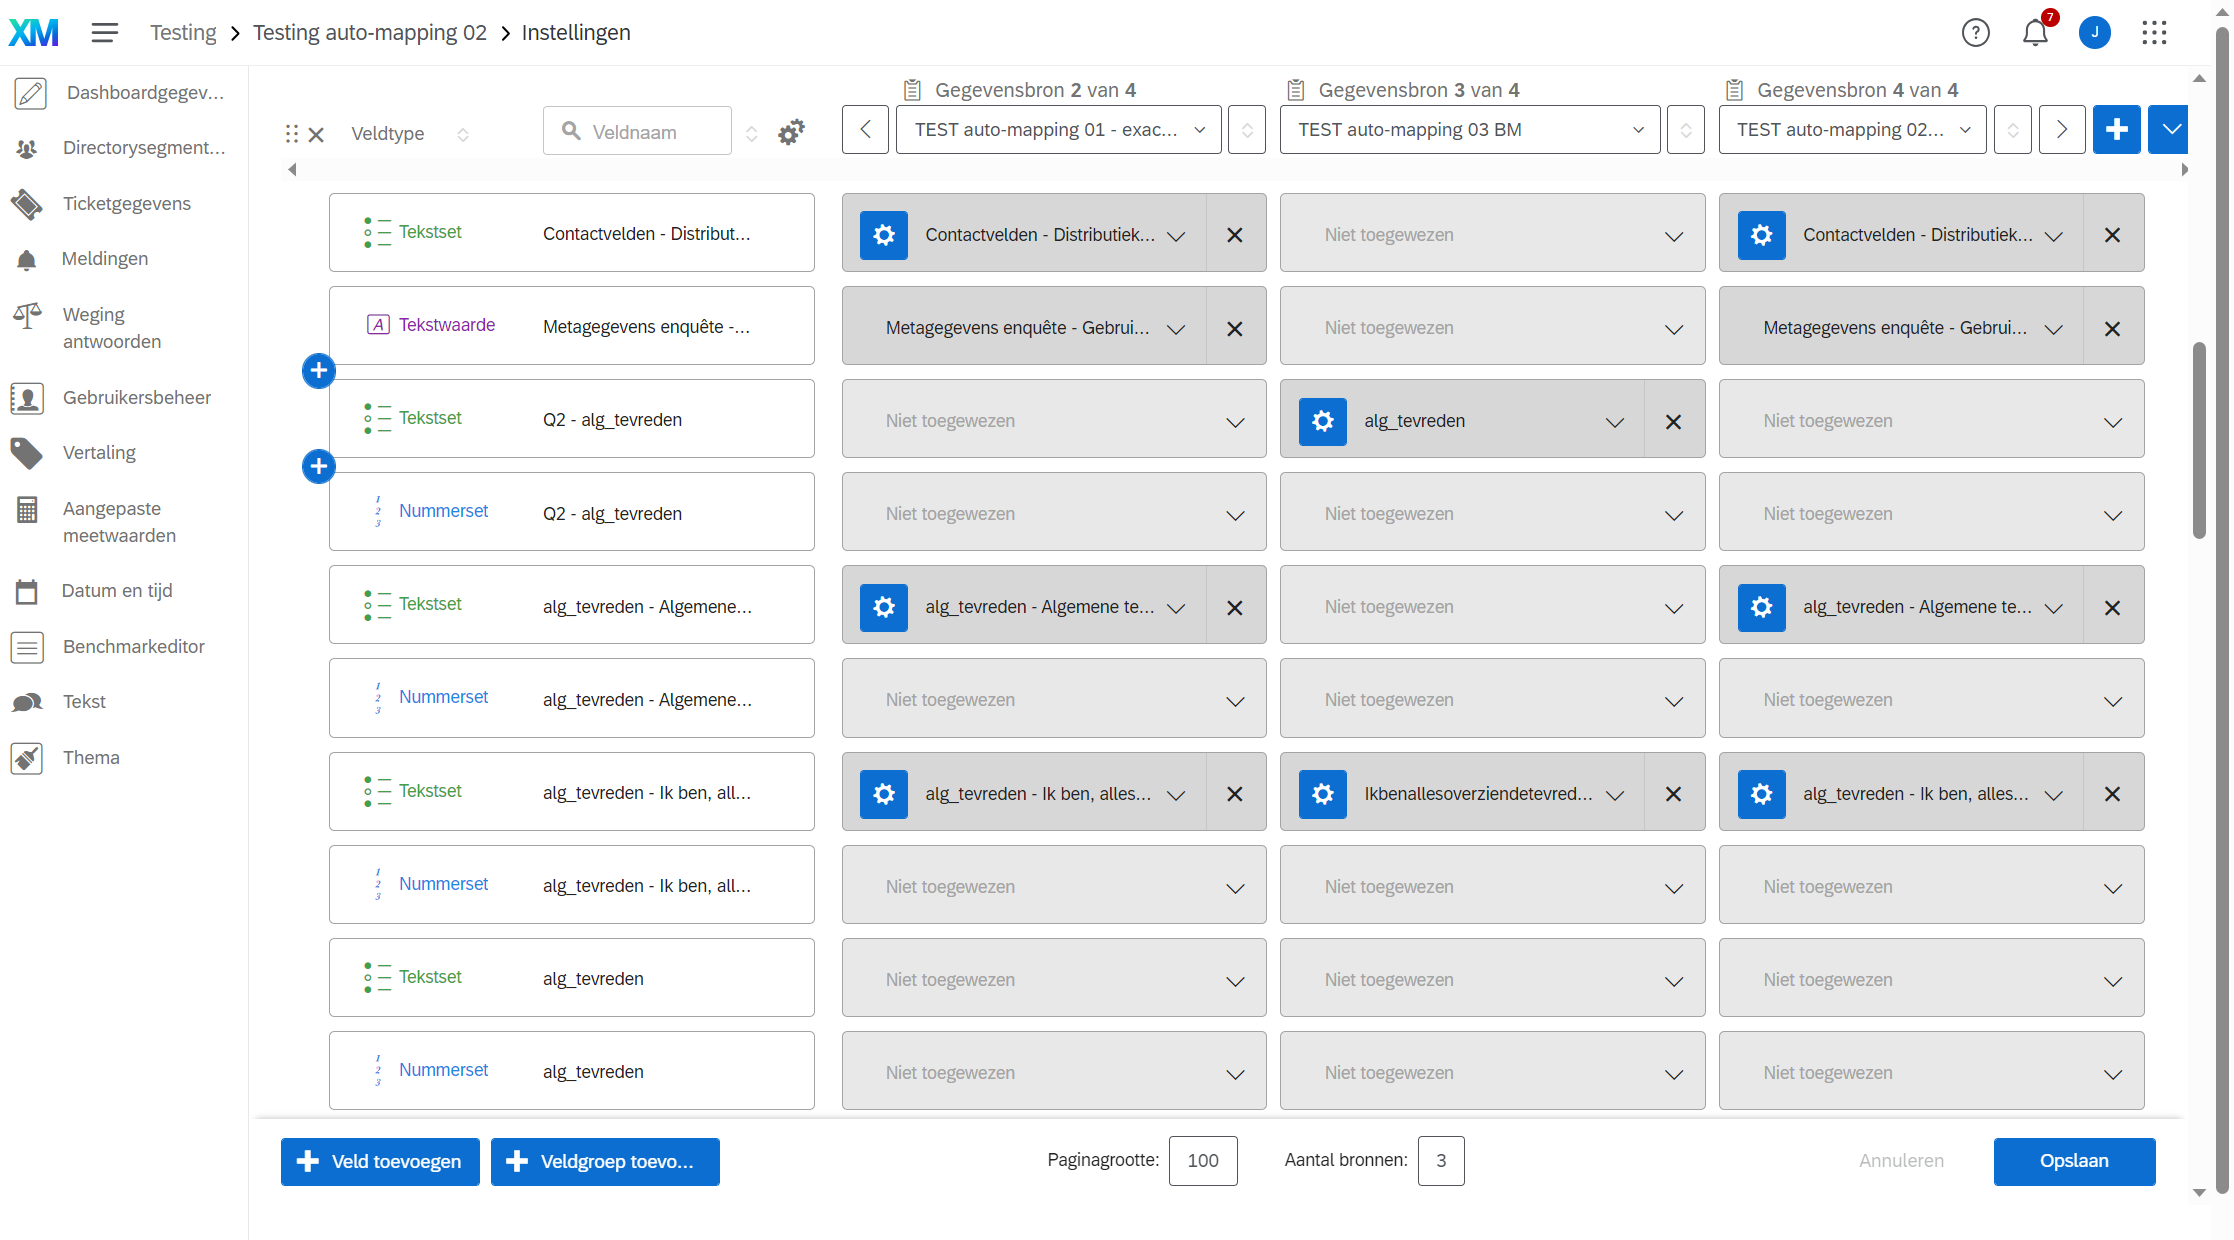
The results of a question need to be exported to a Data Project, then loaded in a Dashboard as a data source. At the same time, the same survey will be a data source in a Dashboard. So in the Dashboard Data I want the auto-mapping feature to work as best as possible.

But the Field names for variables in the Dashboard Data also need to be readable, otherwise I will have to adjust them each time I make a copy of the Dashboard template and add a new Sruvey as data source.

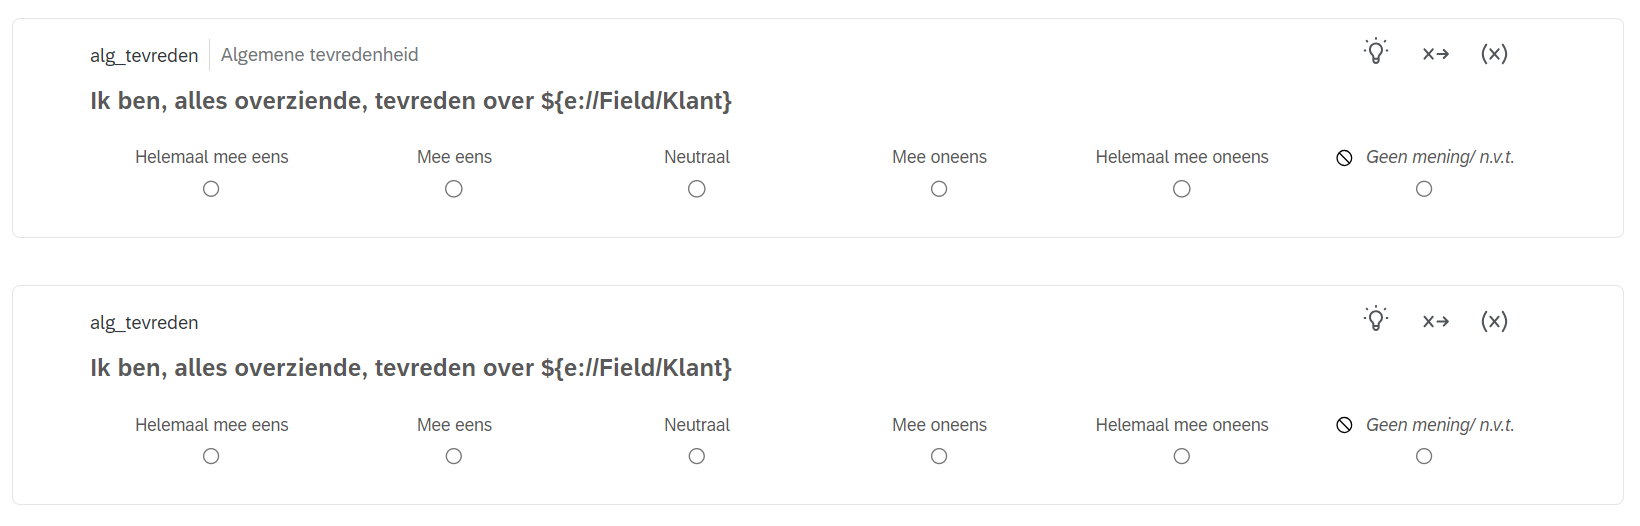
 Right now, I just have the question number to the left, and a code for the question in the Question Label field. Is this the best option?


15 replies

Userlevel 6
Badge +23

Not sure i am a big help here, as this is an area our team struggles with given breadth of our programs. 

We maintain a data governance file (excel) that lists all variable names across each program and before creating any new question/variable names we cross check if there is a suitable existing name used across programs.  So even if there is some variation to question in other programs if it’s close enough we will align naming, so it can be analysed/shown together more easily down the line.  

We also have the issue of renaming them on the dashboards, and for those who export seeing different labels.  So again having a separate record of each of these in excel we can share is a MUST for us.  Character limitations also have prevented us really solving this as well, with descriptive question/data labels,


Userlevel 6
Badge +23

Also excited to hear if others have any better practices I borrow from as well  🙏

Userlevel 6
Badge +12

Thanks @ScottG. I feel like the Support documentation on this topic is a bit lacking. Here and here there is a bit of explanation but no insight as to how the choice of labels affects export of data, import in data projects, mapping in dashboard data. There are some helpful Community post, like this one about the best export tags, this one about matrix labels, and this one about internal IDs, but not much about best practices for Question Labelling.

Here is what I have, again with export and dashboards in mind:

  • Use short and descriptive labels that summarize the question content and are easy to identify in reports and exports.
  • Avoid using special characters or spaces in your labels, as they may cause errors or confusion when exporting or importing data.
  • Use consistent naming conventions for your labels, such as Q_Theme1, Q_Theme2, Q_Theme3, etc., depending on your survey structure and logic.
  • Label every point on your response scales to avoid misdirecting respondents or misinterpreting data. Use clear and balanced labels that match the question type and the measurement level.
  • Use unique labels for each question, even if they have the same wording or format, to avoid duplication or ambiguity in data analysis1.
  • Use descriptive labels for matrix questions, such as M_QuestionText_RowText_ColumnText, to capture the full context of each response option1.
  • Use labels that match the question type, such as MC_SingleAnswer, MC_MultipleAnswer, TE_SingleLine, TE_MultiLine, SL_Slider, etc., to facilitate data processing and visualization1.
  • Use labels that reflect the survey logic, such as Q_SkipLogicCondition, Q_DisplayLogicCondition, Q_RandomizationCondition, etc., to make it easier to track and troubleshoot the survey flow1.
  • Use labels that indicate the measurement level, such as NOM_NominalScale, ORD_OrdinalScale, INT_IntervalScale, RAT_RatioScale, etc., to ensure appropriate statistical analysis and interpretation
  • The Export Tags in a Matrix Table should include the question number or it won't appear in the export. E.g., you will have to type the Export Tag as Q5_Snowboot instead of just Snowboot.
  • Plan for Scalability: If there's a chance you'll add more similar questions in the future, leave room in your naming convention. For instance, if you have MC_sat_general_ORD, consider what you'd name a new, related question added later.
  • Document Your Conventions: Create a reference guide or legend that explains your labeling conventions. This will be invaluable for anyone else working with the data or for your future self.

  • Test Export and Import: Before finalizing your survey, do a test export and import to ensure that all labels come through correctly and that there are no issues with the auto-mapping feature.

For example, if there are three similar satisfaction questions, one would need to use unique labels for each question, even if they have the same question type and response scale. One could do this by adding a suffix or prefix to the label that indicates the specific aspect of satisfaction that is measured:

  1. General customer satisfaction: MC_sat_general_ORD
  2. Satisfaction with the relationship: MC_sat_relationship_ORD
  3. Satisfaction with the information provision: MC_sat_information_ORD

Any tips?

Userlevel 6
Badge +23

@JohannesCE  Your tips are very comprehensive so really appreciate you sharing them!

Maybe Qualtrics will see them and incorporate into their support documentation, as it’s more comprehensive than what I’ve seen to date.

We do the first and last 4 of your tips, there is a few in the middle never considered and will need to explore further.  Albeit a pain is updating any existing naming.

Not sure it’s much of a Tip.  However as I mentioned, we document all the details in a Master Governance file; in case it helps the following is what we log:

  • Change Log
    • Any time variable is added or changed we record the date this was done and by who
  • Embedded Data Variable Log
    • We record Field Name, Field Label and matrix of each of our programs where it is used
    • As mentioned previously, for us our strategy is to use the labels across different programs minimising how many variables we have.  A single program is likely to have up to 150 embedded data variables.
  • Questionnaire Variable Log
    • In addition to Field Name and Description, we record question wording, variables & numbers used for every selection option. In addition to field type and question type.  Followed by matrix where each appears and any known variations i.e. where we have labelled variable the same across programs but have slight variations to wording or selection options.
  • Ticketing Data Variable Log
    • Similar to above, however this time it is all our variables used for ticketing.  This comes from both survey data & embedded data.

The challenge I also have is despite the choices we make it’s not very intuitive to those not familiar with your labelling methodology or can’t see back end of the platform. Like I love the new advanced filter options on dashboards, however we are limited where we can use it as it exposes all variable names which don’t make sense to users outside of our team. We learnt to lock it and edit the description of each filter, but in an ideal world people be able to select their own combination of filters. Our data governance file helps with that, but is still too detailed for our average user. 

Userlevel 6
Badge +12

Thanks @ScottG, that's useful. We have a similar file, but less extended.

I asked Support about this issue, specifically to optimize auto-mapping bteween Data Project and Survey Data as sources in the Dashboard Data. It might be relevant to this discussion:

This was the question:

Context: We have many projects, so we use our own templates for both surveys and dashboards. In a template dashboard all the widgets are in place, and the variables are the same as in the survey template. When we start a new project, I just copy the template and then add the new survey (also from a template) as a source. I also add a Data Project, containing the responses for exactly the same questions from last year. The variables should auto-map, and the data should automatically populate the widgets.

Question: how to organize Question Labels in order to optimize auto-mapping?

This was the answer:

After talking with my team, the labels for the imported data project, are the path the system generates on the backend in order to be able to locate and display the information for the matrix table. 

In the dashboard, the labels are different because the question exists in the survey; the label can be changed for the actual question since it is not a system path like the imported data project label.


Userlevel 6
Badge +23

@JohannesCE interesting and gives more context to what your trying to do which if it worked would be such a time saver! 

With the Dashboard template, are you storing this within Qualtrics template functionality (my understanding is it’s limited to just Qualtrics default templates, hopeful I missed something here).  Or have you created a project with your template that you duplicate each time you need it (we do this).  Just want to make sure I’ve not missed a trick to template the dashboards.  

Userlevel 6
Badge +12

 I just wanna reiterate that my goal wat optimizing auto-mapping of a secondary source. According to Support, this should not even be possible:

You will need to manually map the fields of additional data sources since additional data sources will not be automatically mapped according to this support page. (Support employee)

Additional data sources will not be automatically mapped, so you will need to map their fields manually. (Support page)

Even though Support employees and the Support page suggest that the additional sources need to be mapped manually, but when I test it, this does not seem the case.

Userlevel 6
Badge +12

Here's how I tested it.

The survey I created has some test questions with 4 kinds of combinations of Question Labels, Numbers, Export tags.

  • I first added the original survey (source 1), thus creating all the variables in the DB data
  • Then I added an exact copy (source  2) of that survey. Some variables auto-mapped, others didn't
  • Then I added a Data Project (source  3), created through an ETL workflow from the responses of survey 1
  • Then I added a survey containing data created from survey 1, also via a workflow (source 4)

The result is strange. Survey 1 is out of view in this screenshot:


Userlevel 6
Badge +12

The best option, at least for MC, seems the one where I have a unique code where the question number should be, and the question label left empty (which will be replaced by the long question title when loeading to a Data Project). This works even when you add a Data Project with the same variable, automatically created via a workflow.

OR, if you don't need the Data Project, a unique code where the number should be and a short version of the question for the question label.


Userlevel 6
Badge +12

@JohannesCE interesting and gives more context to what your trying to do which if it worked would be such a time saver! 

With the Dashboard template, are you storing this within Qualtrics template functionality (my understanding is it’s limited to just Qualtrics default templates, hopeful I missed something here).  Or have you created a project with your template that you duplicate each time you need it (we do this).  Just want to make sure I’ve not missed a trick to template the dashboards.  

Hi @ScottG , I think we're doing it the same way. As far as I know there's not template functionality except for the built-in dashboard page templates such as the Directory Funnel. It would be great if Qualtrics could add a feature like that! For example, the ability to save a page of widgets in the Library and then add it just like one does with blocks or questions in the Survey Builder.

Userlevel 6
Badge +23

@JohannesCE I thought that was the case, but good to know it’s the same approach.  I’ve definitely raised the idea of it to Qualtrics in a few forums, so fingers crossed it happens at some point.

I also want to be able to edit a saved widget in the library and have that update automatically everywhere it is used.  It would save me hours each week and more importantly ensure consistency across our quite complex programs.

Userlevel 6
Badge +23

@JohannesCE just realised I missed the earlier comments too.  My last response was to the last comment.  Appreciate extra clarity and further example shared above as well!

Userlevel 6
Badge +12

@ScottG did you post the idea in Coda? If you give me the title we can upvote is :)

Userlevel 6
Badge +23

@JohannesCE Good question, I can’t recall and I couldn’t see it searching for it.   So I just submitted it and they can de-dupe it if there is another I guess.  I’ll post link again when available.


Here was my requests/suggestions I shared with our Qualtrics account team last quarter in no particular order.

  1. Dashboard publishing step required (prevent accidental edits).
  2. Ability for users to record actions or notes whilst viewing CX dashboards. 
  3. Assigning sensitive data rules to individual data variables to prevent download of specific fields. 
  4. Split export permissions to vary permissions between dashboard export vs widget export.
  5. Dashboard usage by users should be able to be mapped and inserted into a CX dashboard.  
  6. Enable different brands within the one instance to use their own vanity URL.
  7. Ability to save dashboard templates and widget configurations with ability to bulk publish changes to set widgets across multiple dashboards/pages. 
  8. Ability to select different trended time periods used across trend charts. 
  9. Ability to map survey data and ticket data onto a singular CX dashboard
  10. Remove 20 topic limit within Text iQ widget for Relative Importance. 
Userlevel 6
Badge +23

New Idea reference in CODA is EV-1930

(Ability to save your dashboard page templates and specific widget configurations within the library to select from.)


Leave a Reply