Clickable table with automatic value transfer in subsequent text | XM Community
Skip to main content

Dear Community,


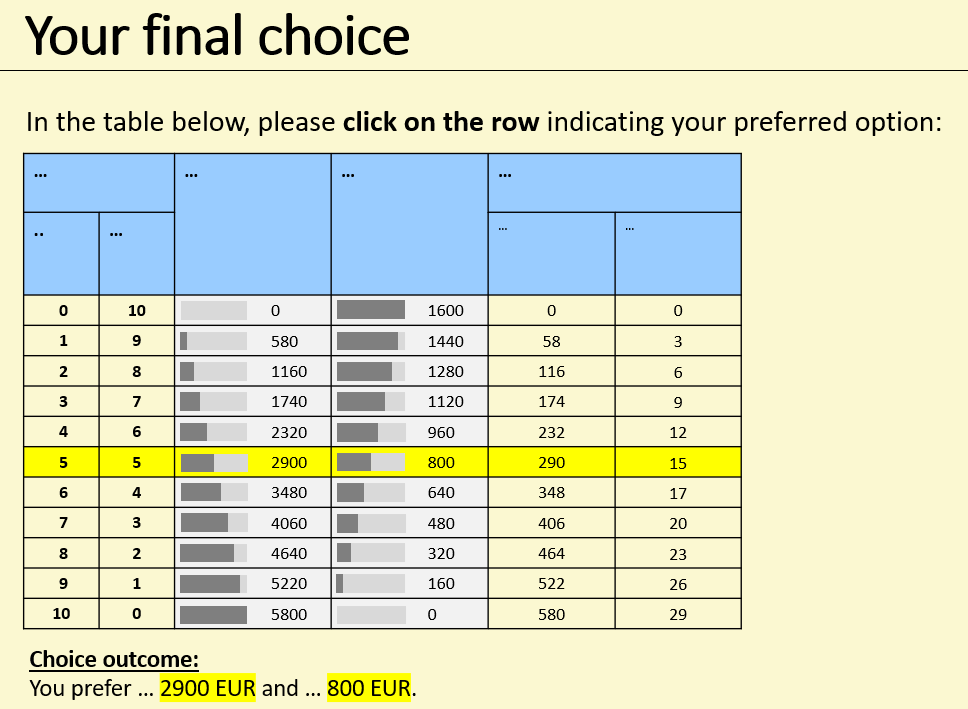
I would like to create a table as shown below. It shall be a clickable table to indicate their preferred option, which is then highlighted. At the same time,  values from this row shall be automatically inserted in a text below the table for a better understanding.


Example: Participant prefers the row highlighted in yellow below. Then the values from the 3rd and 4th column are automatically inserted in the text below the table (see also highlighted in yellow).


Is this or something similar possible to implement in Qualtrics?


Thank you very much!

Laura


You can replicate the same over a matrix table without the horizontal bar graph.


@lamori You’ll first need to create an HTML of the table. Probaly something like exporting your excel to HTML or building it in R/Python.


After that, you should post that HTML code in the HTML section of the question. Then add the JS below to the question javascript.

Qualtrics.SurveyEngine.addOnReady(function () {
const quest = this;
const qc = quest.getQuestionContainer();
const allRows = Array.from(qc.querySelectorAll("tr"));

const highlightRow = function (ev) {
const target = ev.target;
let targetRow;
if (target.tagName == "TR") {
targetRow = target;
} else {
const ancestors = target.ancestors();
for (let i = 0; i < ancestors.length; i++) {
if (ancestorsti].tagName == "TR") {
targetRow = ancestorsti];
break;
}
}
}
allRows.forEach((row) => (row.style.backgroundColor = ""));
targetRow.style.backgroundColor = "yellow";
};

allRows.forEach((row) => (row.onclick = highlightRow));
});


It will then look something like this.


Thank you for your responses!

For better comprehension I should keep the bar charts in the rows.

Would it be possible to insert the table as a picture and put boxes to click left of every row? This could replace the highlighting of rows…


Leave a Reply