Hello! I am hoping the community minds here might have a solution to our issue. We have a standard question that we need to use in many evaluations for evaluating knowledge before and after education. The question itself LOOKS amazing and we get very high response rates on it because its so easy to fill out.
HOWEVER - the problem is that when we go to do the reporting for these questions, we have to manually download the numbers for the before and after and then calculate the statistics, and then make a custom format to put them together in an executive-friendly manner.
So all of this work is rather taxing on the reporting side, and I am trying to see if there is any way that I can improve the process. Do you guys have any thoughts? Changing the question type, an easier way to calculate the stats, an easier way to do the reporting - I'm all ears! :-)
I have included a question and the reporting example below to make it easier to see what I'm talking about.
Question Example: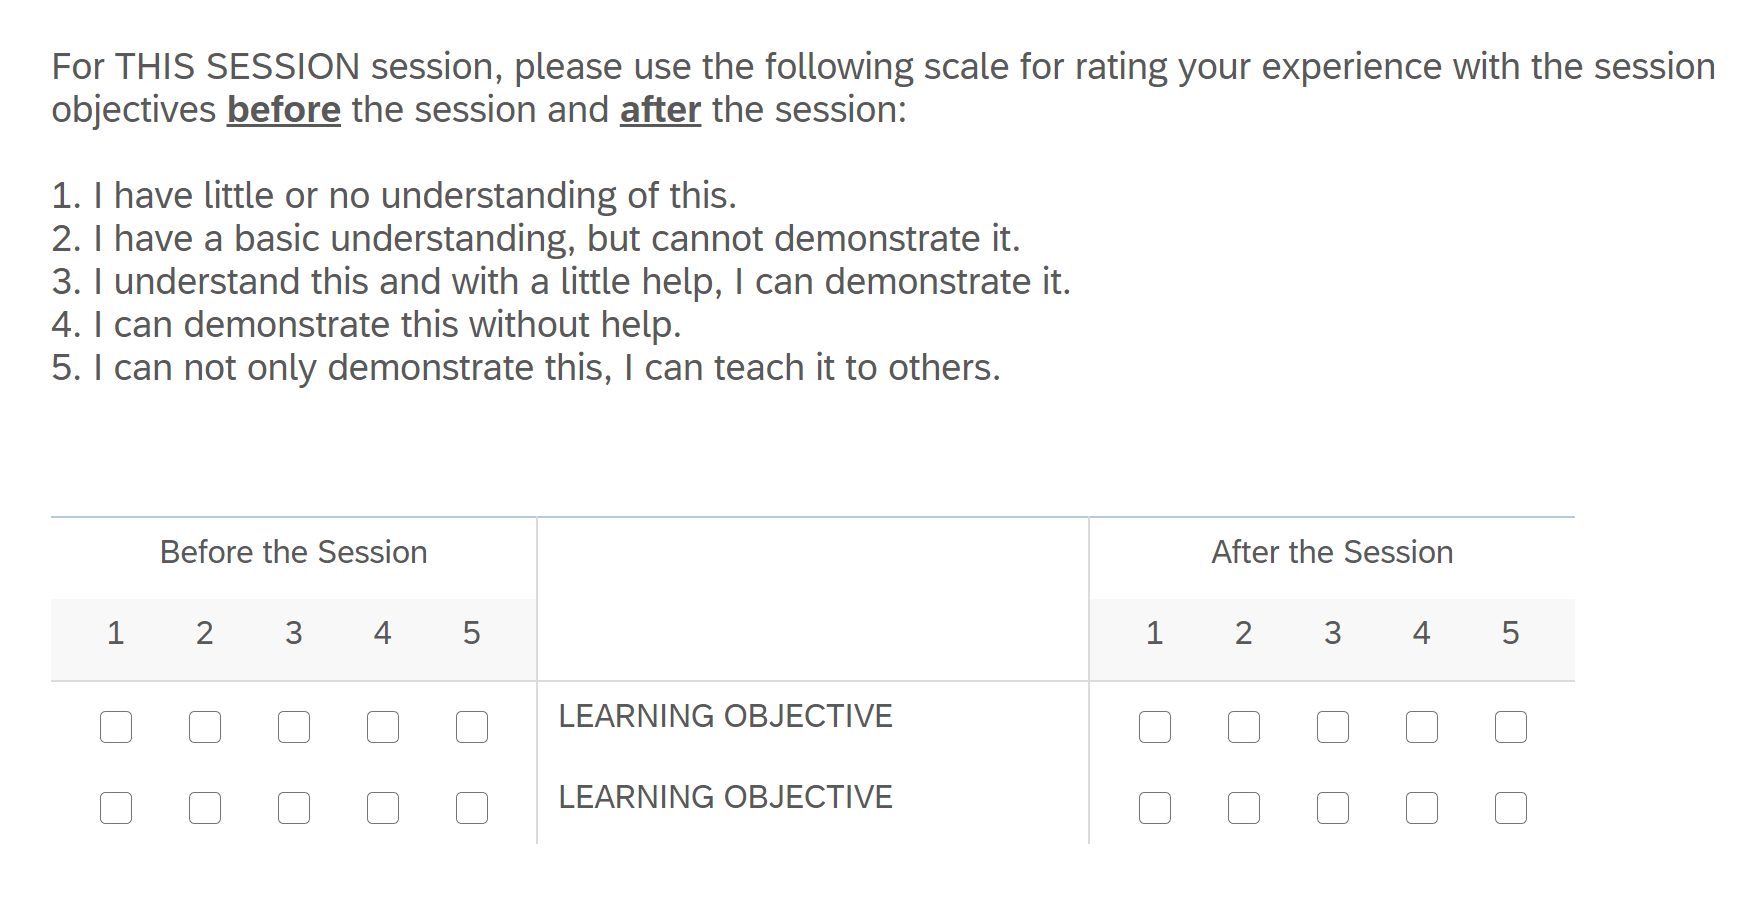 Output with added calculation for mean statistic:
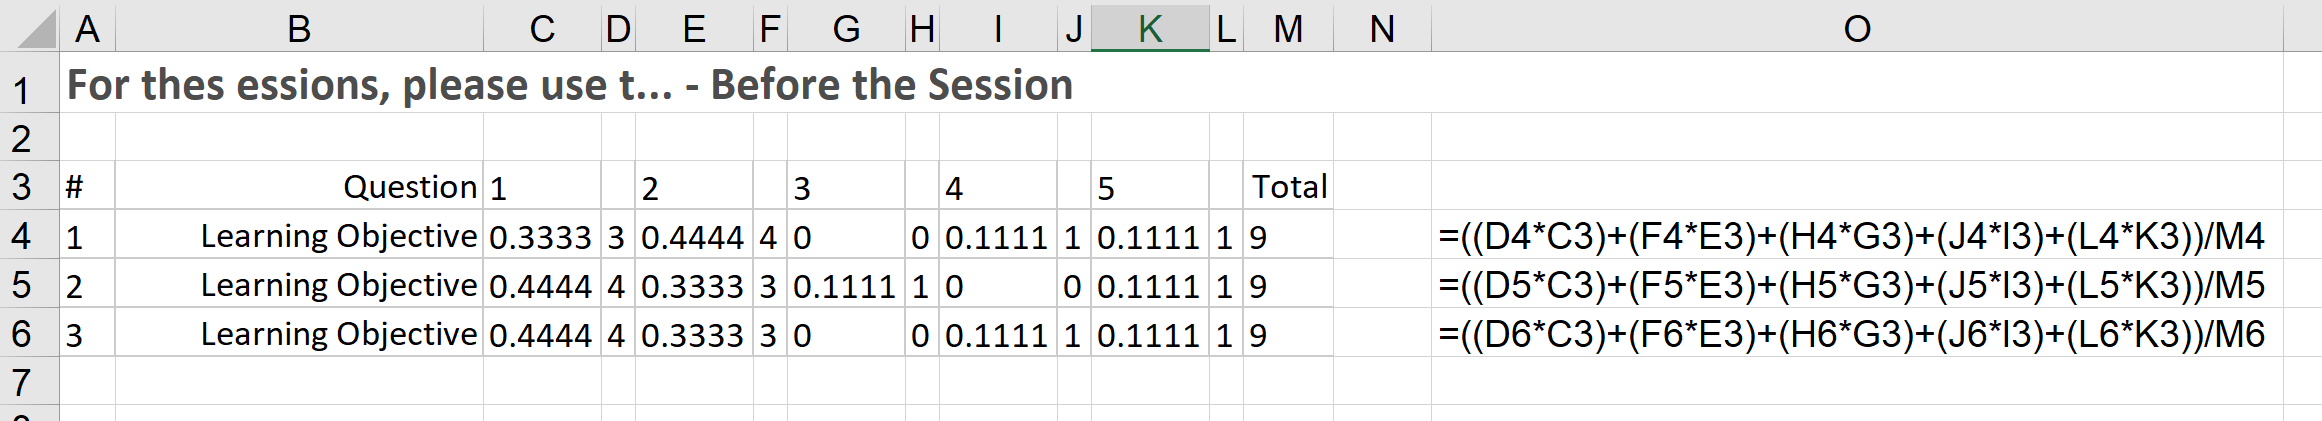
Reporting after all the work is done: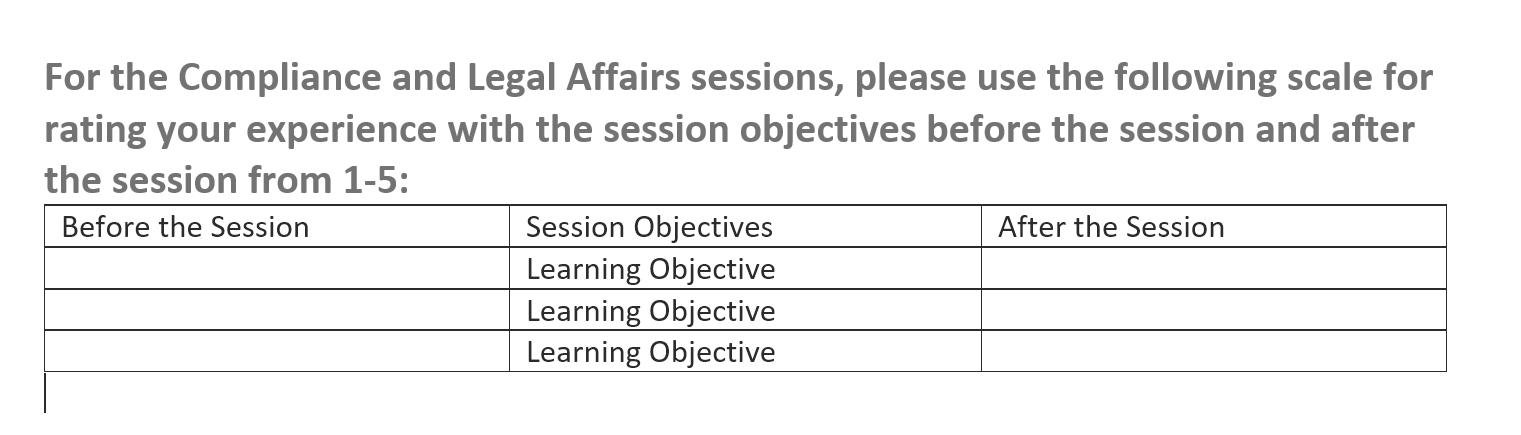

Is there a better way to ask this question? Reporting is very difficult.
 +7
+7


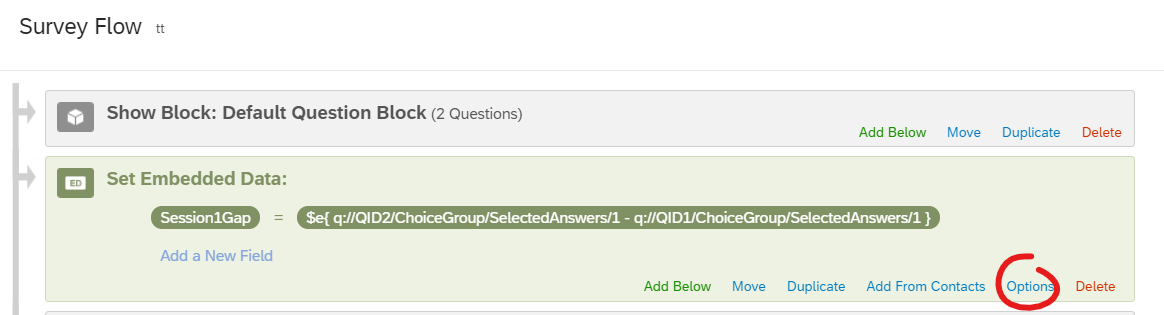 Then if you click on "options" you can change the embedded data type to a number.
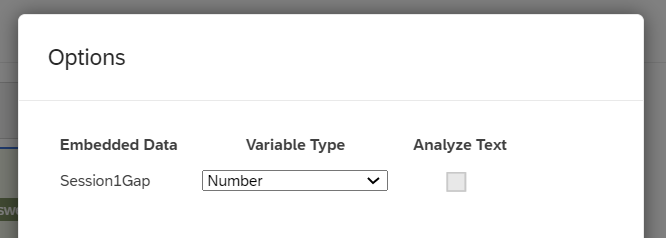
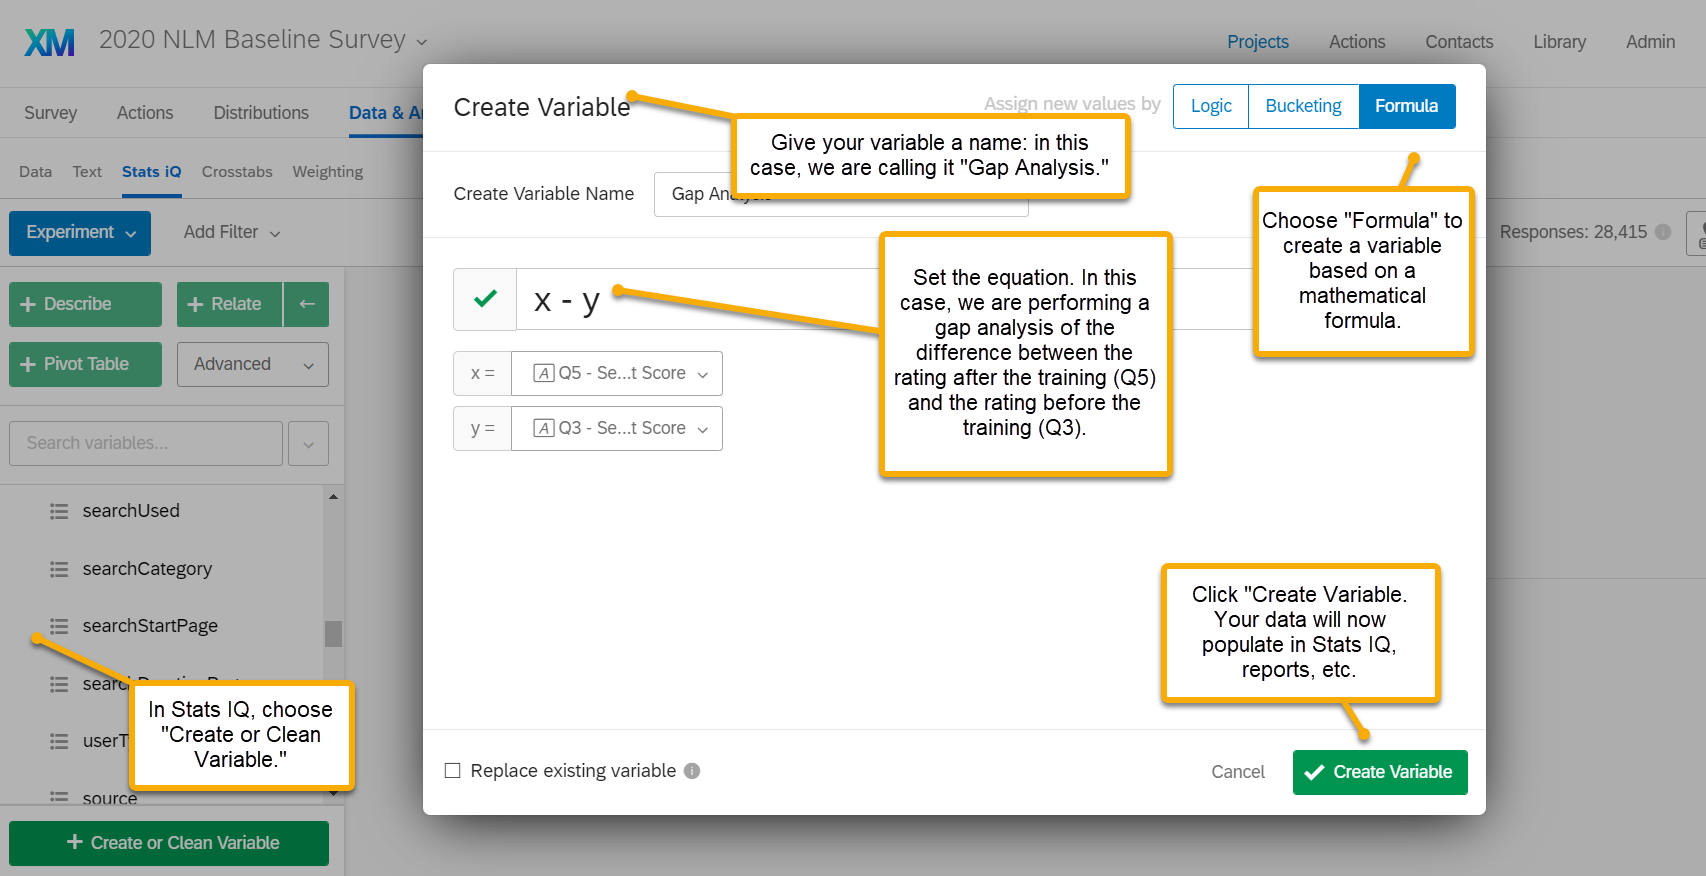
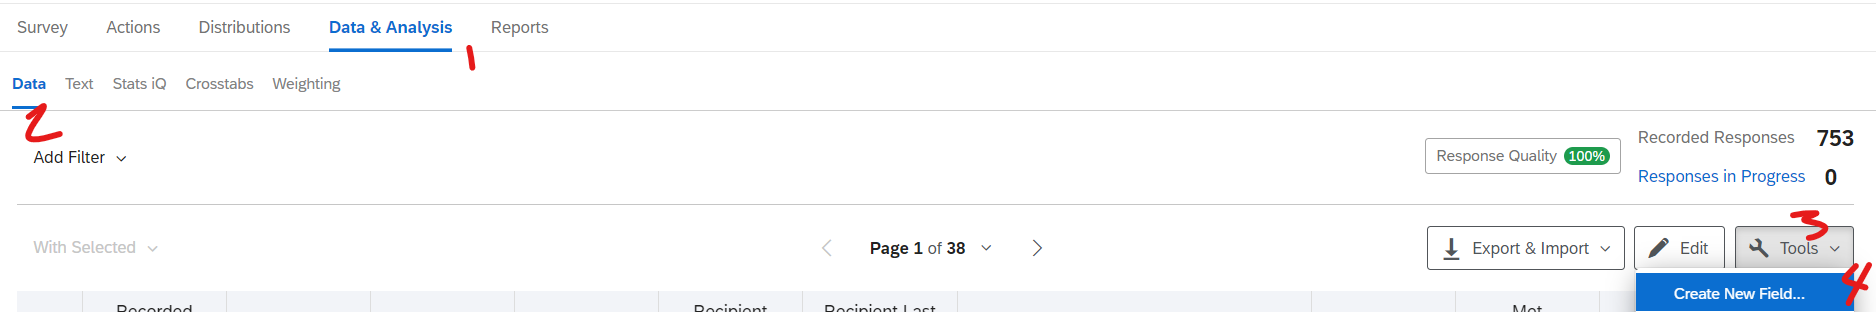 You'll see a screen like the one screenshotted below. Click on the "formula" option and then follow the same steps that AdamK12 suggested previously
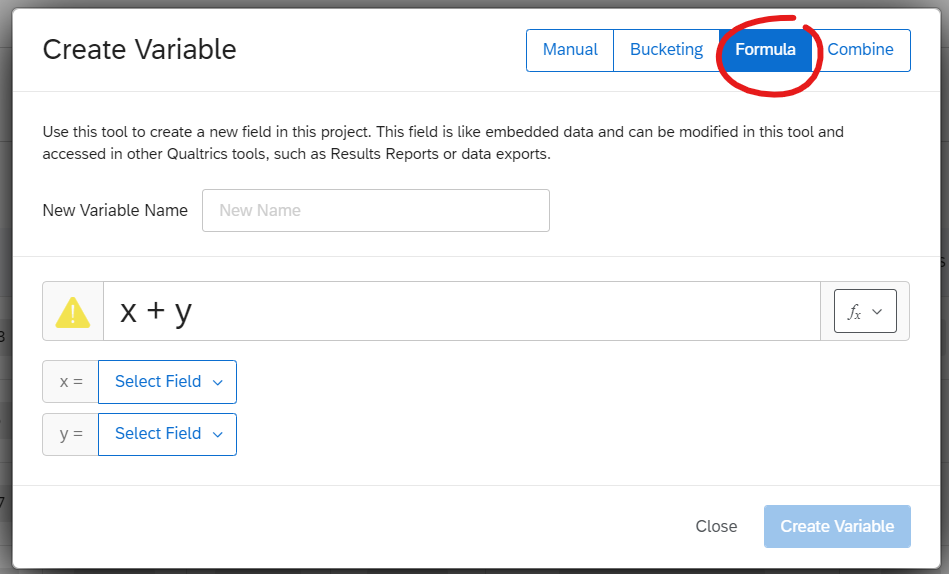
Sign up
Already have an account? Login

Welcome! To join the Qualtrics Experience Community, log in with your existing Qualtrics credentials below.
Confirm your username, share a bit about yourself, then you're ready to explore and connect .
Free trial account? No problem. Log in with your trial credentials to join.
No free trial account? No problem! Register here
Already a member? Hi and welcome back! We're glad you're here 🙂
You will see the Qualtrics login page briefly before being taken to the Experience Community.
Login with Qualtrics
Welcome! To join the Qualtrics Experience Community, log in with your existing Qualtrics credentials below.
Confirm your username, share a bit about yourself, then you're ready to explore and connect .
Free trial account? No problem. Log in with your trial credentials to join. No free trial account? No problem! Register here
Already a member? Hi and welcome back! We're glad you're here 🙂
You will see the Qualtrics login page briefly before being taken to the Experience Community.
Login to the Community
No account yet? Create an account
Welcome! To join the Qualtrics Experience Community, log in with your existing Qualtrics credentials below.
Confirm your username, share a bit about yourself, then you're ready to explore and connect .
Free trial account? No problem. Log in with your trial credentials to join.
No free trial account? No problem! Register here
Already a member? Hi and welcome back! We're glad you're here 🙂
You will see the Qualtrics login page briefly before being taken to the Experience Community.
Login with Qualtrics
Welcome! To join the Qualtrics Experience Community, log in with your existing Qualtrics credentials below.
Confirm your username, share a bit about yourself, then you're ready to explore and connect .
Free trial account? No problem. Log in with your trial credentials to join. No free trial account? No problem! Register here
Already a member? Hi and welcome back! We're glad you're here 🙂
You will see the Qualtrics login page briefly before being taken to the Experience Community.
Enter your E-mail address. We'll send you an e-mail with instructions to reset your password.