Widget displaying highest and lowest scores | XM Community
Solved

Widget displaying highest and lowest scores


Userlevel 6
Badge +12

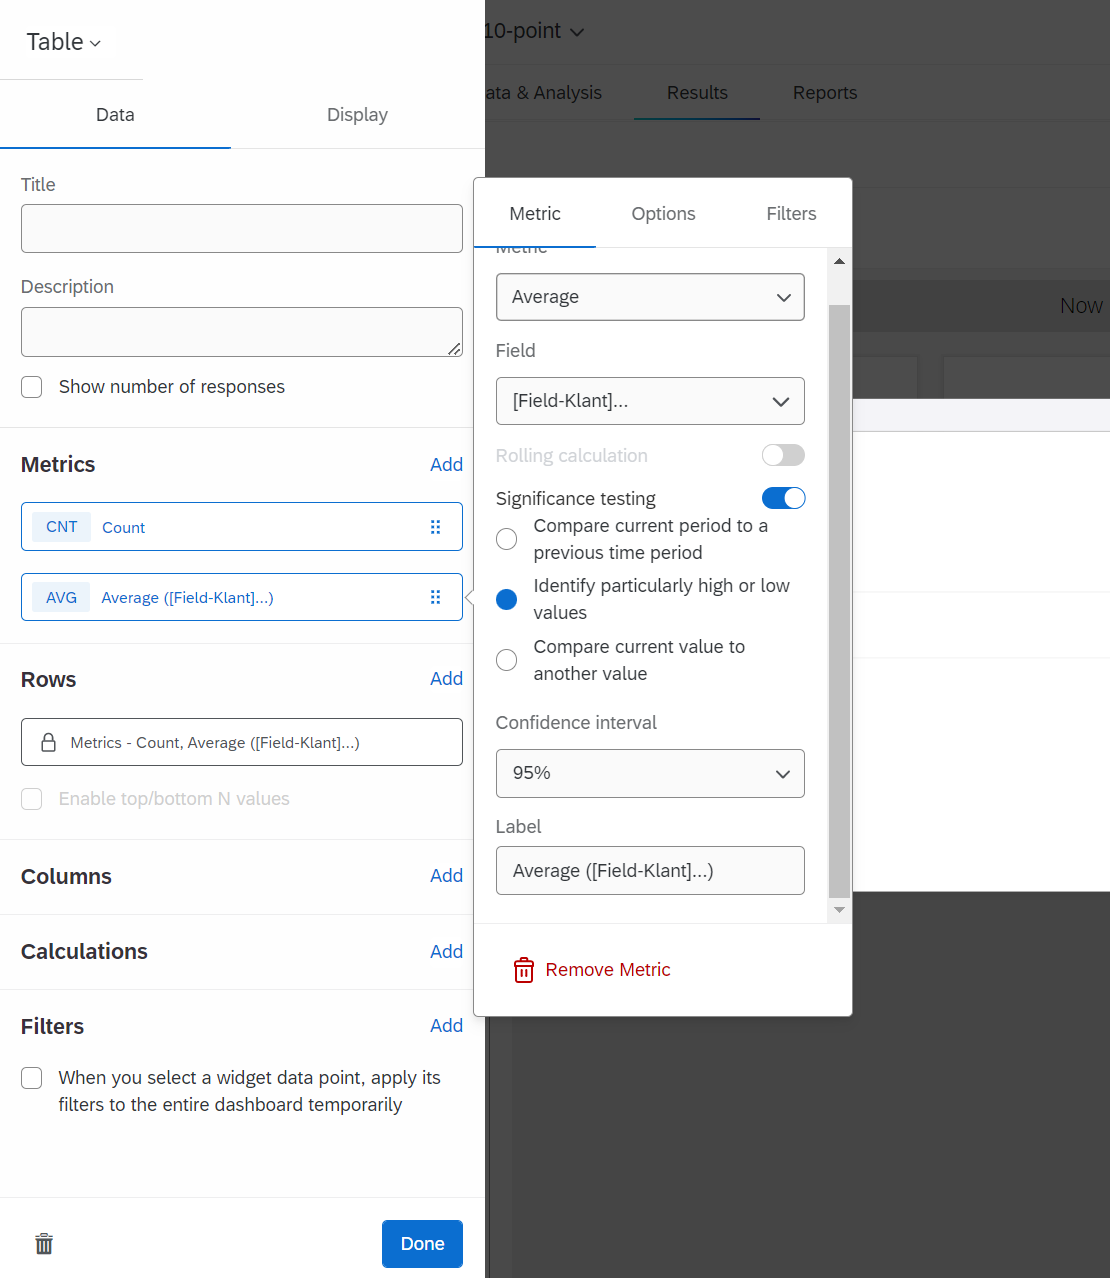
Here's the issue: I have a buch of KPI's in the survey which respondents can rate on a likert-scale. I recoded the Likert values to a 10-point scale (7.5 for “agree” etc). In both the Results page and the Dashboard I want a widgets which shows the 10 highest and the 10 lowest scoring KPI's out of basically all the Likert-scale questions.

There must be a way to do this with the Table widget, but I can't seem to make it work. Ideas?


icon

Best answer by JohannesCE 5 May 2023, 12:25

View original

3 replies

Userlevel 7
Badge +20

In dashboard I hope you have added all “likert-scale” question field into one group field which has “number set” as a field type.

Then in a bar chart can you try a metrics as average and the select the group field? 

Userlevel 6
Badge +12

Thank you, @MohammedAli_Rajapkar, that helped. The first part was correct: I created a group, filled with all the recoded Likert-scale questions as number set. That enabled me to use the whole group in the widgets.

For the second part the solution was to use a Table widget, put the average of the group in the metrics, the group also in the rows, then apply top/bottom N values (top 5).

Userlevel 6
Badge +12

@MohammedAli_Rajapkar perhaps you know how I can reproduce this in the Results tab of the survey? How can I group the Likert questions there?

Leave a Reply