Combining Matrix and Multiple Choice results in one widget | XM Community
Skip to main content
Solved

Combining Matrix and Multiple Choice results in one widget


JohannesCE
Level 6 ●●●●●●
Forum|alt.badge.img+12

Hello! I want to combine the results from 2 question in 1 Dashboard widget. It's not working out, so I hope you can help with a solution or a good alternative :)

  1. The first question is a matrix with 7 KPI's, which the respondent can rate on a Likert scale. The Likert scale is recoded to a 10-point scale in the survey (Completely disagree = 0, Completely agree = 10).
  2. The second question is a multiple choice with the same 7 KPI's. The respondent can select 2 of the KPI's he/she finds most important.

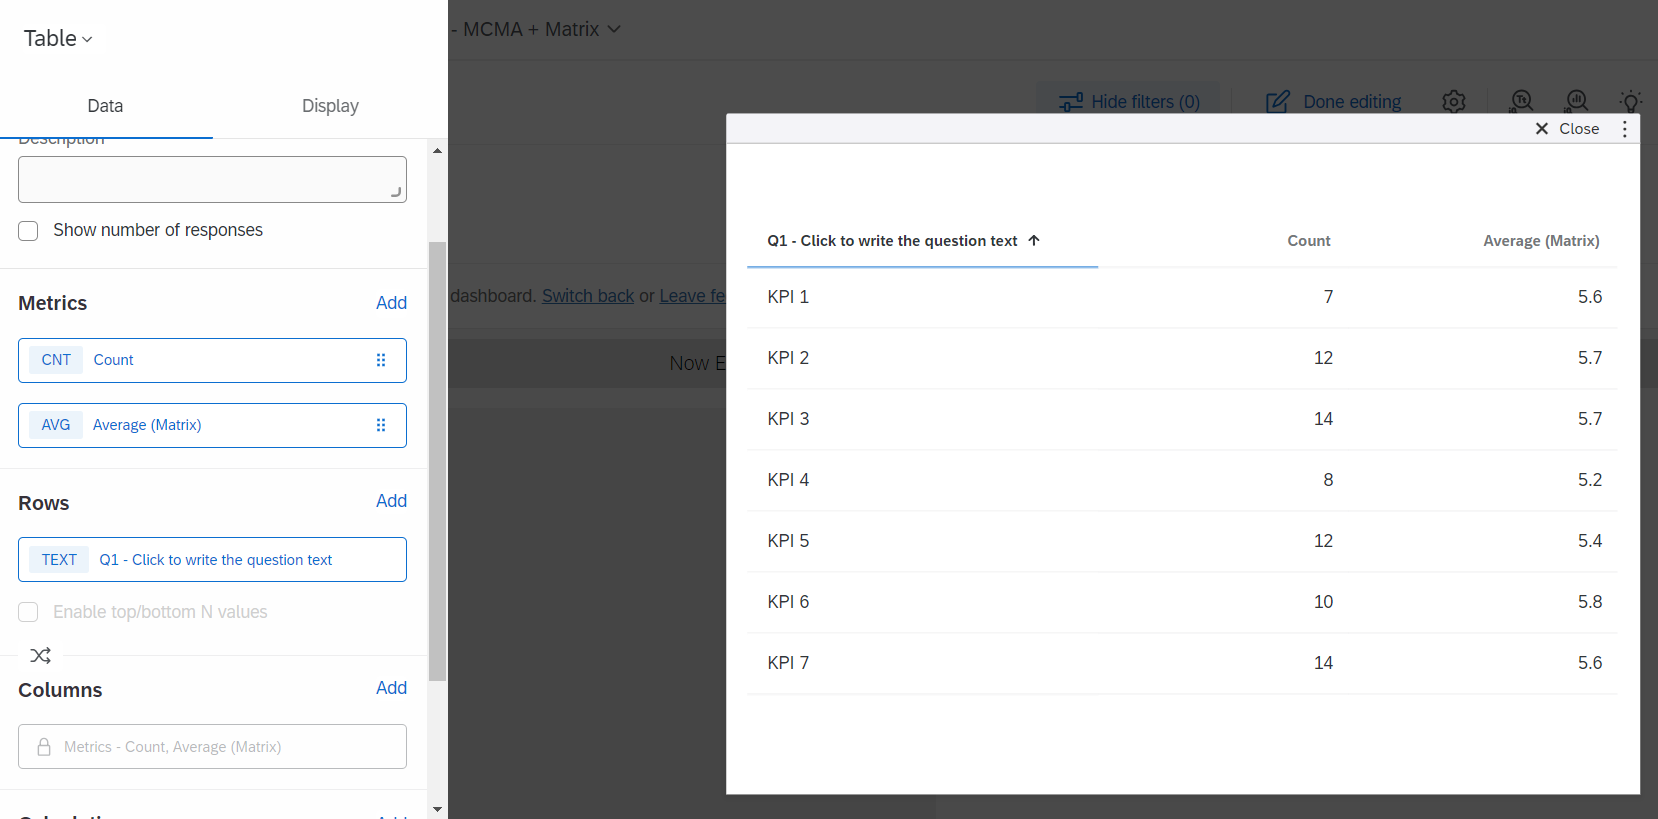
In the Table widget, I want to first show the amount of times a KPI has been selected (2), then average score (1). I can't seem to achieve this. Is it possible at all to achieve this? Or should I structure the survey questions differently? How?

Best answer by vgayraud

Hi @JohannesCE 


The 1st metric is a simple count and the 2nd is the average on a measure group of the 7 KPIs mapped as number sets. Rows is your MCMA where you select the top 2.

View original

6 replies

Aanurag_QC
QPN Level 5 ●●●●●
Forum|alt.badge.img+31
  • 256 replies
  • September 8, 2023

I think the pivot table widget might have helped here, can you try the new table widget? That might work out in this case.


Forum|alt.badge.img+14
  • Level 5 ●●●●●
  • 276 replies
  • September 8, 2023

In your dashboard settings, you can click “Add Field Group” at the bottom and add all the statements that you want to be in the same widget into that field group.

Then, you can select that field group’s name when configuring your widget.


Forum|alt.badge.img+14
  • Level 5 ●●●●●
  • 276 replies
  • September 8, 2023

Forum|alt.badge.img+25
  • Level 4 ●●●●
  • 61 replies
  • September 9, 2023

Instead of using the Pivot Table (highlighted in yellow), I would suggest using Table (as shown in the blue circle) widget as shown in the below SS. The reason behind not to use the Pivot table is as per the Qualtrics communication they are going to deprecate some widgets soon.


JohannesCE
Level 6 ●●●●●●
Forum|alt.badge.img+12
  • Author
  • Level 6 ●●●●●●
  • 144 replies
  • September 13, 2023

Thank you @Aanurag_QC and @ash123 en @Shobhit for your replies. 

It's not exactly what I mean though. I know of course that I can make a group, but I need to show the two metrics side by side. 

I think the difficulty is that one question is a matrix, so a series of likert-scale MC, and the other is a MC text set where the respondent choses 2 out of 10 options.

So in the dashboard you get 10 variables (Number Set) on the one hand, and 1 variable (Text Set with multiple answers) on the other hand. I can't join those in one group. 


vgayraud
QPN Level 5 ●●●●●
Forum|alt.badge.img+48
  • QPN Level 5 ●●●●●
  • 374 replies
  • Answer
  • September 13, 2023

Hi @JohannesCE 


The 1st metric is a simple count and the 2nd is the average on a measure group of the 7 KPIs mapped as number sets. Rows is your MCMA where you select the top 2.


Leave a Reply