Hi,
I created a scale (Kolbs Learning Style Inventory) and intend to provide - as an incentive t participate - each participant with his/her individual result. I used Kolb's earlier approach with 10 ranking questions and managed to create the summary scores for the 4 dimensions.
I just don't know how I can provide these 4 values to the survey participants. One way would be to distribute the results via email , but I intended to collect the answers anonymously. Is there a way to provide the results immedaitely after the participants finish the survey?
Thanks,
Uwe
Page 1 / 1
At the end of the survey add a "descriptive text" and within which you can piped-text the result of the user.
The user will see it as soon as they complete the survey.
Thanks, but it seems that I can only provide the results of specific questions, but not of calculated fields (index values), or did I miss something?
In survey options click on show response summary, so when respondent complete survey ,they will see all there responses on screen.
Thanks bansalpeeyush29 , but I only want to display 4 index values resulting from of 40 questions ... ideally in a grafical display (scatterplot).
Here's what I want to do ...
Hello @ukohlmann ,
The point suggested by @bansalpeeyush29 can work for you...refer to the snapshot below, which is available in Survey Options tab-->
!
Let me know if this works.
Thanks,
Swa
The point suggested by @bansalpeeyush29 can work for you...refer to the snapshot below, which is available in Survey Options tab-->
!
Let me know if this works.
Thanks,
Swa
Hi Swa,
can I edit this Response Summary in any way? Currently this summary displays all questions, and I only want to provide 4 summary values calculated from 40 questions
BTW: I am impressed by how quickly I find support in this commuity 😀
can I edit this Response Summary in any way? Currently this summary displays all questions, and I only want to provide 4 summary values calculated from 40 questions
BTW: I am impressed by how quickly I find support in this commuity 😀
In that case You have to store these 4 values in embedded data and that you have to pipe it on last page of survey.
Hi @ukohlmann ,
Other option is as follows:
Click on "Survey Termination" --> "Custom End of Survey Message"
!
Fetch the end of survey message from message library. In the stored message you can pass the information required (any question / embedded variable) with the help of piped text.
!
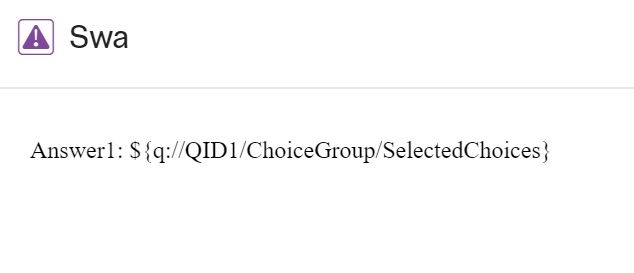
I tried this in one simple question and it works.
Let me know if there are any queries.
Regards,
Swa
I am not sure if you able to get the scatterplot but we can display a graph (in terms of the score)
- Attached is the QSF (survey) in which I've kept 4 questions on which I want to give a score...
- Created 4 embedded data, 1 for each question to hold the score... (if you want you can capture the score in 1 embedded data as well)
- In the end, I've created a slider bar question which will show the score for each question (you can also consider it as a block of questions)
- In this slider question, I have used the default choice option and assign the embedded data for each choice.
https://qimpl.az1.qualtrics.com/jfe/preview/SV_2tr4zUdhFNGh63H?Q_SurveyVersionID=current&Q_CHL=preview
If Q1=Choice 1 then Q1 score is 10
If Q2=Choice 2 then Q2 score is 10
If Q3=Choice 3 then Q3 score is 10
If Q4=Choice 2 then Q4 score is 10
Wow, great support here!
I am still struggling with creating embedded data out of my calculated fields.
I see my scores in the data&analysis tab, but I don't see them when I want to create piped text. The challenge seems to be to make them to embedded data, that is available for piping text.
Another option would be to create a sum of values out of piped text. I assume that's not possible, since it's piped text and not piped numbers.
The easiest option probably is, to abndon my idea of using question format ranking. When I use a question format that allows for scoring, I'd be fine, since the scores are easily available for piped text.
However, @Mohammedali_Rajapakar_Ugam : can you direct me to the page in the manual that tells me how you created the embedded data that you used for your visualisation (great workaround, by the way, I'd never thought of that!).
Cheers,
Uwe
actually, here's the scale I am talking about
Happy to help...
Here is the support page for embedded data:
https://www.qualtrics.com/support/survey-platform/survey-module/survey-flow/standard-elements/embedded-data/
Here is the support page for piped-text:
https://www.qualtrics.com/support/survey-platform/survey-module/editing-questions/piped-text/piped-text-overview/
You can piped-text anything it is not restricted to "text"
Also, here is the default choice (which i used for slider question) documentation:
https://www.qualtrics.com/support/survey-platform/survey-module/question-options/add-default-choices/
Let us know if you need any help
ok...
You should try "Math operator" with "recode value" for addition. Here is the support page:
Math operations:
https://www.qualtrics.com/support/survey-platform/survey-module/editing-questions/piped-text/math-operations/
Recode value:
https://www.qualtrics.com/support/survey-platform/survey-module/question-options/recode-values/#RecodingValuesAndChangingVariableLabels
attached is the qsf.
Thanks @Mohammedali_Rajapakar_Ugam ! You certainly gave me a lot of homework. I'll share my experiences as soon as I am through with this
Cheers,
Uwe
Cheers,
Uwe
I finally found a solution to make it work! Thank you, everyone, for all your help!
As you recommended, the easiest approach was to use question formats that allow the option “scoring”. I just created different Scoring-categories to represent the 4 dimensions I want to end up with. This way, I was able to select 1 of 4 items per question among the 10 questions and sum up the assigned scores, whereas every category contains the sum of certain selected items. The downside of this solution is that people can assign the same value over different items within a question (but I want them to exclusively rank the items within each question).
Since the question format “ranking” does not allow the option “scoring”, I used embedded data with math operations.
The following code works the way I want to:
Category 1 =
$e{q://QID1/ChoiceNumericEntryValue/1 + q://QID2/ChoiceNumericEntryValue/1 + q://QID3/ChoiceNumericEntryValue/1 + q://QID4/ChoiceNumericEntryValue/1 + q://QID5/ChoiceNumericEntryValue/1 + q://QID6/ChoiceNumericEntryValue/1 + q://QID7/ChoiceNumericEntryValue/1 + q://QID8/ChoiceNumericEntryValue/1 + q://QID7/ChoiceNumericEntryValue/1 + q://QID8/ChoiceNumericEntryValue/1}
Category 2 =
$e{q://QID1/ChoiceNumericEntryValue/2 + q://QID2/ChoiceNumericEntryValue/2 + q://QID3/ChoiceNumericEntryValue/2 + q://QID4/ChoiceNumericEntryValue/2……..}
and so forth..
Thanks everyone ... great community!!
Cheers,
Uwe
Leave a Reply
Enter your E-mail address. We'll send you an e-mail with instructions to reset your password.