💡​​​​​​​3 Steps to set up your Course Evaluations | XM Community
Skip to main content

💡​​​​​​​3 Steps to set up your Course Evaluations


brookel
Groups Administrator
Forum|alt.badge.img+5
  • Groups Administrator
  • 2 replies

This month we will be highlighting course evaluations, read below to see a few helpful tips to set up your course evaluations program:

  1. Build your Course Evaluations
    1. You can quickly build course evaluations from a bank of expert-designed questions within Qualtrics (Reach out to your account rep if you need help here)
    2. Utilize the template course evaluation questions to build internal benchmarks
    3. Add additional questions specific to the course, instructor, department, etc.
  2. Launch your program
    1. Drive response rates by enabling students with a single course evaluation experience for multiple courses and instructors. 
    2. Consider integrating with learning management systems via LTI integration.
    3. Set up feedback reminders for students
  3. Take Action on your own Insights
    1. Set up reporting dashboards (they are mobile-optimized, user-friendly, and easy to navigate)
    2. Set up role-based permissions allowing you to enable each user to view the results relevant to them. For example, a professor would only be able to view feedback related to their courses, while the chair of the department can view data for the entire department or filter down by instructor, course, semester, year, division, etc.

How is your institution currently using Qualtrics to improve your courses? What advice would you give to other institutions when setting up their course evaluations?

Click here to view a course evaluation QSF.

18 replies

ashleigh_quaill
Level 3 ●●●
Forum|alt.badge.img+19

We are using Qualtrics Course Evaluations tool for our surveys. I would love to hear from other institutions who are also using it! It would be awesome to see a dedicated space within the Community for this particular product. There’s often not a lot of public facing resources about it so we take every opportunity we can get to find out more.


brookel
Groups Administrator
Forum|alt.badge.img+5
  • Author
  • Groups Administrator
  • 2 replies
  • June 12, 2023
ashleigh_quaill wrote:

We are using Qualtrics Course Evaluations tool for our surveys. I would love to hear from other institutions who are also using it! It would be awesome to see a dedicated space within the Community for this particular product. There’s often not a lot of public facing resources about it so we take every opportunity we can get to find out more.

@ashleigh_quaill Thanks for your feedback here. We are actively working on providing more resources for you on this topic.


Hillary Blevins
Level 5 ●●●●●
Forum|alt.badge.img+6

We are using the Qualtrics Course Evaluation tool at Walden University. Happy to chat about our experience with anyone who is interested.


brookel
Groups Administrator
Forum|alt.badge.img+5
  • Author
  • Groups Administrator
  • 2 replies
  • August 11, 2023
Hillary Blevins wrote:

We are using the Qualtrics Course Evaluation tool at Walden University. Happy to chat about our experience with anyone who is interested.

Thank you for your willingness to engage! We appreciate you.


Forum|alt.badge.img+13

@ashleigh_quaill @Hillary Blevins Hi Ashleigh and Hillary, I came to learn how other people notify their faculty about the Qualtrics course evaluation response rate. Our dashboards are configured to hold off on releasing data until the semester's grades are posted. Could there be an additional dashboard that solely displays the response rate for the semester? To make sure faculty are seeing the right figures, I would need to somehow break the semester down into 8 weeks and the end of the semester. This time, we have included Blackboard in the Qualtrics Course Evaluation, but thus far, we have not noticed a rise in the response rate.  This is the first whole semester that we have used Qualtrics Course Evaluation so feeling the learning curve.


Forum|alt.badge.img+13

@Hillary Blevins Have you come up with a method that allows department administrators to print every course evaluation without needing to select each one individually for exportation?


Hillary Blevins
Level 5 ●●●●●
Forum|alt.badge.img+6

@Linda_charlton We use the Dashboard feature to share aggregate data with our academic leadership. We limit access by assigning user roles and have filters for college, program, course, term, instructor, etc. so they can see what they need.

We also have a minimum response size of 5 for display and do not share individual responses, to protect the privacy of our students. (We have 65K+ students so that would not work at scale.)


Regarding the response rate, I have not found a perfect solution for this. We use the survey, Course Evaluation, and Dashboarding modules, and best I can tell, panel data from the survey module isn’t available in the Dashboard module. This means that a traditional response rate (# people got an invitation and # of those people responded) isn’t available. Instead, we report on four similar measures (including a modified response rate), which can be included in the dashboard: 

  • Delivery rate - % sent invitation emails that were successfully delivered to students.
  • Open rate - % delivered invitation emails that were opened by students.
  • Response rate - % students who started an evaluation from an opened invitation email.
  • Completion rate - % students who finished an evaluation that they had started.

While this approach takes some initial explaining to get everyone on the same page with the definitions, it does show us where in the process the biggest gaps are so we can take action to close them.


Forum|alt.badge.img+13

@Hillary Blevins We have different dashboards for each role (Instructor, Dean, Chair) each have filters also that shows everything aggregate data.  But how do your instructors get updates on how their surveys are doing?  Our instructors want to see how their rates are doing and we have not figured that part out yet.

Up to Spring 2023 the instructors could decided the questions, when they wanted the survey to go out and if they wanted paper or online.  Spring 2023 we decided to go all online and no customized questions for the department or instructor or customized dates.  So been learning curve for everyone while we are learning the system. 


Hillary Blevins
Level 5 ●●●●●
Forum|alt.badge.img+6

@Linda_charlton we have one dashboard for the institution and user roles for vice provost, dean, program director, faculty, course design staff, and IE staff. Logic in the role assignment restricts the view to the appropriate level. (Deans see college/program/faculty level, program directors see program/faculty level, faculty see their own course level, etc.)


The way we have the engagement data presented, it would have to be filtered by term to compare rates over time. We may be able to use some breakouts or a table to show change over time (if the source data is accessible that way), but we have not had enough demand to make that a priority.


ashleigh_quaill
Level 3 ●●●
Forum|alt.badge.img+19

@Linda_charlton we run two sets of dashboards. One is a live response date dashboard which is connected to the survey project as responses come in. This dashboard only shows response rates (number of responses, number of invitations, calculate percentage response rate). It’s a complex exercise as we have to use a survey project to upload the number of invitations (we generate a file with every combination of demographic filters available in the dashboard and then a column for “count of student_course”, which the dashboard then sums as total number of invitations), and we grant access for all staff to see the data across the whole university - no data restrictions on what courses are visible. The only restriction is that demographics (gender, age, course, etc) are only available to senior staff on a separate page of the dashboard. Within the main page of the dashboard (where everyone sees all data for all courses in the university), we also have widgets displaying responses received over time so that they can see peak times where more responses come in. In the future we may look to display the split between LTI completion (used to be Blackboard for us but is now Canvas) vs email completions - at the moment we report this manually in a summary document after the end of the major semester surveys.

Our second set of dashboards is our results dashboards. These are connected to another survey project and when grades release is finalised, we then export responses from the live project (used above) and then import them into our “reporting project” which is connected to results dashboards. This means we can control when responses are made available to staff. This is also where we get really specific on role based access to data. Teaching staff can only view the responses for the courses in the terms when they were teaching in them (e.g. if you teach Engineering 101 in Semester 1 but not in Semester 2, you will only see the Semester 1 data). There are also roles for other staff like a Head of School will see all the data for their school and they have access to more aggregated data.


Forum|alt.badge.img+13

@ashleigh_quaill I was surprised that the summary of distribution didn't have the breakdown of email and Blackboard.  I was interested in knowing how the students were taking the surveys.


ashleigh_quaill
Level 3 ●●●
Forum|alt.badge.img+19

@Linda_charlton you can grab it in embedded data in the survey responses for Distribution Channel. It will either be COURSE_EVAL_LTI (for Blackboard) or COURSE_EVAL_EMAIL.


Forum|alt.badge.img+13
  • Level 3 ●●●
  • 86 replies
  • April 24, 2024

@ashleigh_quaill thank you for all the information our team figure out how to do the dashboard and I figured out how to see what channel the students are using to respond to the surveys.


csulb.spot.6584
Level 1 ●
Forum|alt.badge.img
Hillary Blevins wrote:

@Linda_charlton We use the Dashboard feature to share aggregate data with our academic leadership. We limit access by assigning user roles and have filters for college, program, course, term, instructor, etc. so they can see what they need.

We also have a minimum response size of 5 for display and do not share individual responses, to protect the privacy of our students. (We have 65K+ students so that would not work at scale.)


Regarding the response rate, I have not found a perfect solution for this. We use the survey, Course Evaluation, and Dashboarding modules, and best I can tell, panel data from the survey module isn’t available in the Dashboard module. This means that a traditional response rate (# people got an invitation and # of those people responded) isn’t available. Instead, we report on four similar measures (including a modified response rate), which can be included in the dashboard: 

  • Delivery rate - % sent invitation emails that were successfully delivered to students.
  • Open rate - % delivered invitation emails that were opened by students.
  • Response rate - % students who started an evaluation from an opened invitation email.
  • Completion rate - % students who finished an evaluation that they had started.

While this approach takes some initial explaining to get everyone on the same page with the definitions, it does show us where in the process the biggest gaps are so we can take action to close them.


Hi @Hillary Blevins,

Did you create special custom metrics to make these measures? We use two surveys: 1. Course Evaluation survey that produces student responses & 2. Reimport Survey that’s basically the course information where each row of data represents one student enrolled in a course. These create two datasets that we use for our custom metric response rate & feeds the dashboard (response count/enrollment count). Mind if I send you a direct message about this please? The email details of our course evals to students are there listed individually by distribution, but it isn’t exportable data to analyze nor summarized for us to interpret meaningfully. I appreciate your input!


csulb.spot.6584
Level 1 ●
Forum|alt.badge.img
Linda_charlton wrote:

@ashleigh_quaill I was surprised that the summary of distribution didn't have the breakdown of email and Blackboard.  I was interested in knowing how the students were taking the surveys.

Hi @Linda_charlton,

The course Evals by distribution do provide a count of how many responses came from LTI vs email I think but unsure how this works.


Forum|alt.badge.img+13

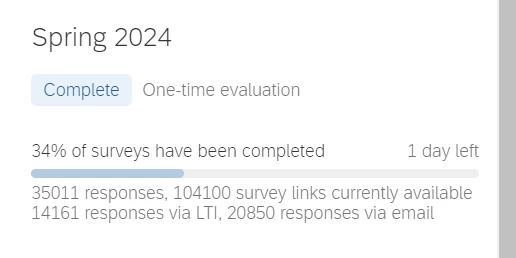
@ashleigh_quaill  and @csulb.spot.6584  After I said that I didn’t see the breakdown I found the information listed for me in the evaluation part.  I also added the channel embedded data to breakdown the information in the Course Evaluation and the Instructor Evaluation raw data.  We also have any courses that have 5 or less students locked so no one see that data until there is enough data to share.  Just FYI the numbers here is showing the first time we did the LTI.


Hillary Blevins
Level 5 ●●●●●
Forum|alt.badge.img+6

csulb.spot.6584 happy to discuss this separately.


jlsisthebest
Level 6 ●●●●●●
Forum|alt.badge.img+28
  • Level 6 ●●●●●●
  • 29 replies
  • June 12, 2024

We use the platform for our entire assessment system, but one item we keep getting asked about is passing grades back to our LMS.  Many of our assessments are also used as in class assignments so we would be able to increase response rate and buy in from faculty if they could score a student on a rubric say a 27-30 and have that pass back as an a or 95.  We’ve created the scoring elements, embedded data with a total, mean etc… but I’m not sure of a way to have that go back to our LMS.


We’ve migrated to LTI 1.3, but our LMS is older, and I don’t see any way to connect them.  Does anyone have any experience with that?


Leave a Reply