How To Create a Simple Score Report just number. | XM Community
Skip to main content

Hi Folks, 

                 I have created an IT Survey where I have a lot of question with a scale of Very Dissatisfied to Very Satisfied and I was able to create de below breakdown bar joining the answered in three categories following the instruction in the below post.

How to create a breakdown bar joining five parameters in just three. | XM Community (qualtrics.com)


Additionally, I would like to Add the score as a simple result of favorable % in the square similar as the below picture that is the Employee engagement survey as an example, is this possible?
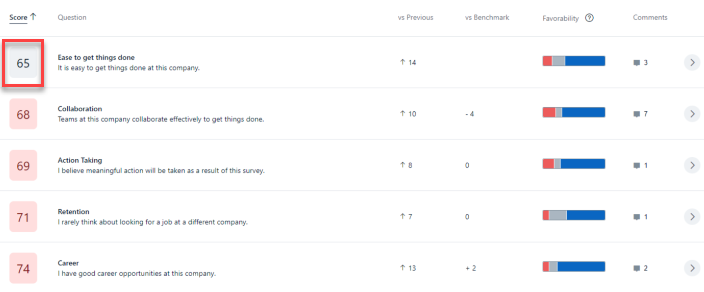
 

I don’t know if you know how to do the VS Previous too! :-)


Thank you in advance for all your help!!

Hi @Ierodri, It’s me again
I’m afraid the Report page you’re using don’t have that number chart you’re looking for.
Gotta move to the dashboard for more options. Don’t worry, the merge field still work there.

P/S: Dashboard just give you more options, can’t guarantee that cute tiny number or some EX widget. You gotta present it in a more creative way.


Hi @dxconnamnguyen,

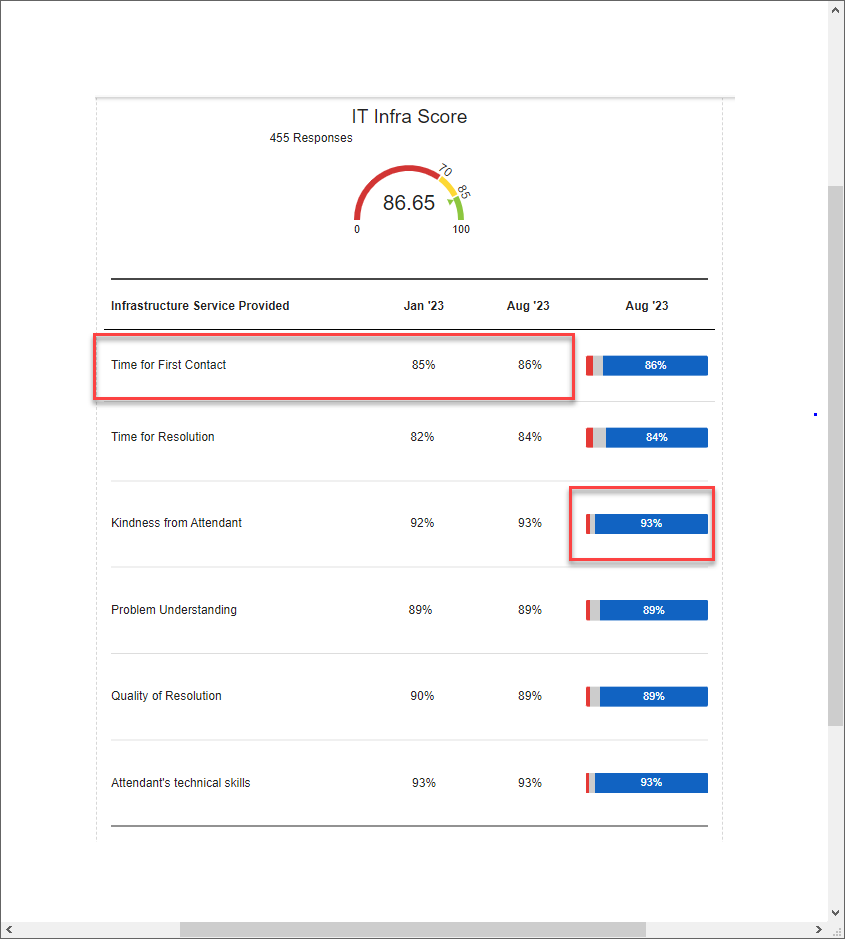
                                            Thank you for your fast replay! I found a best way to represent that I liked to do see below picture.


Each question is a Sigle table whit hided header with two parameters, and the breakdown bar is individual too.


I hope this can help to someone else.


Regards.


@Ierodri Glad you found a nice workaround. It even looks good on the report page with that little breakdown bar. You did great 👍.
I didn’t think this report tab has much capability since I mostly work with dashboard and got overwhelmed with it’s widgets in compare to this. You prove me wrong.


@dxconnamnguyen I second you about the dashboard it has more functionality and features. We can implement different widgets and can do analysis instead of a report page.


Leave a Reply