Is there a way to show survey respondents how their answers compared to other respondents? | XM Community
Skip to main content
Solved

Is there a way to show survey respondents how their answers compared to other respondents?

  • September 20, 2018
  • 3 replies
  • 361 views

M_Palko
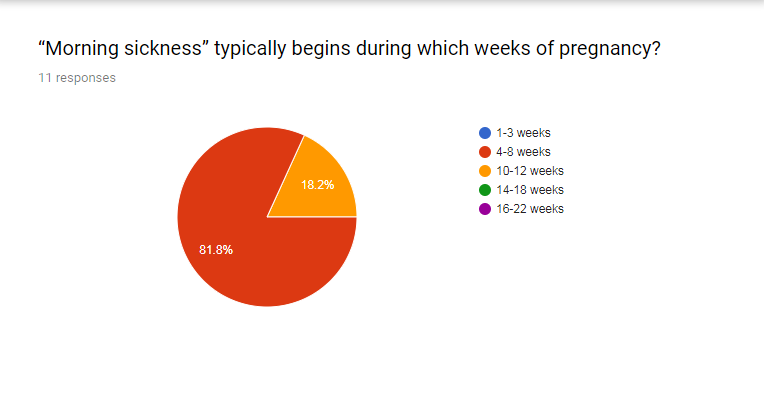
I'm using short surveys to boost students' retention of things they've learned in class. Is there a way, ideally at the completion of the survey, to show how their answer compared to the larger group's responses? If so, how is that accomplished? Google Forms gives that option (see below) !

Best answer by MohammedAli_Rajapkar

Yes, you can do this with the help of reporting. Create a custom page in the result section of the report tab. On that custom page select the question for which you want to create a pie visualization. Hide the rest of the question from that custom page, so that it will only show the pie chart. Then get the URL for that report, which is under share report option [Public Reports]. Below is the documentation of it, if you go through this then you will be able to understand the above steps. https://www.qualtrics.com/support/survey-platform/reports-module/results-section/reports-overview/#AboutResultsReports In the survey, you will have to create a descriptive text type question, within which under "Rich content editor" you will have to utilize the <iFrame> syntax (https://www.w3schools.com/tags/tag_iframe.asp) and within which you will have to paste the public report URL.
View original

3 replies

PeeyushBansal
Level 6 ●●●●●●
Forum|alt.badge.img+39
  • Level 6 ●●●●●●
  • 1144 replies
  • September 21, 2018
By reports you can show this. You have to use role based dashboard where add widgets and fix filters like for overall and global filter student. So every student can see only there data along with overall.

MohammedAli_Rajapkar
QPN Level 5 ●●●●●
Forum|alt.badge.img+20
Yes, you can do this with the help of reporting. Create a custom page in the result section of the report tab. On that custom page select the question for which you want to create a pie visualization. Hide the rest of the question from that custom page, so that it will only show the pie chart. Then get the URL for that report, which is under share report option [Public Reports]. Below is the documentation of it, if you go through this then you will be able to understand the above steps. https://www.qualtrics.com/support/survey-platform/reports-module/results-section/reports-overview/#AboutResultsReports In the survey, you will have to create a descriptive text type question, within which under "Rich content editor" you will have to utilize the <iFrame> syntax (https://www.w3schools.com/tags/tag_iframe.asp) and within which you will have to paste the public report URL.

Forum|alt.badge.img+5
  • Level 3 ●●●
  • 204 replies
  • October 8, 2020

@Mohammedali_Rajapakar_Ugam 
Is there a way to do this if the survey response has not been submitted yet? So create a visualization in the middle of a survey showing the results from an earlier block of the survey.


Leave a Reply